Pharmacy Information Systems · Data Engineering · React
Modernising Pharmacy Reporting & Preparing a Predictive Stock Pipeline
SijilPharma · KPI Dashboard Redesign + Incremental ETL for Demand Forecasting
I redesigned the analytics reports of a real pharmacy system (SijilPharma) and built a local incremental ETL + feature store to prepare a future sales forecasting module.
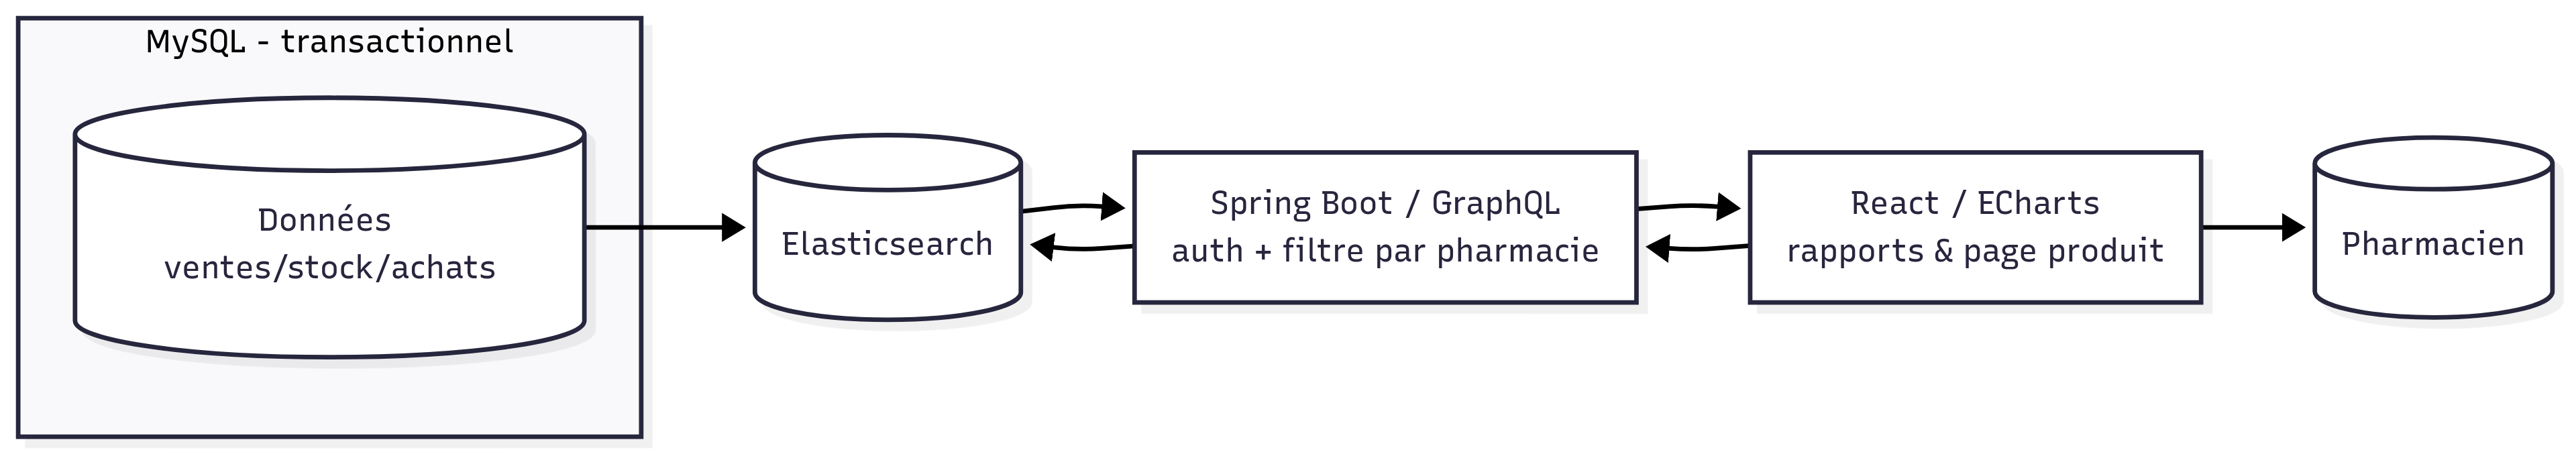
Figure — Global view of the SijilPharma analytics and predictive pipeline, combining the production KPI dashboard with the experimental ETL and feature store for future forecasting.
1. Overview
Résumé Exécutif
This internship project has a dual objective: modernise the existing analytics reports of the SijilPharma management software (sales, purchases, stock, revenue) and design an experimental data pipeline that prepares structured datasets for a future sales forecasting module.
In production, I worked inside an existing Spring Boot / GraphQL / Elasticsearch / React stack to improve the KPI dashboard UX and extend the product detail page with new interactive charts. In experimentation, I built a local incremental ETL with feature engineering that reads from a SQL view and generates daily, weekly, and monthly CSV datasets ready for machine learning.
The project sits at the intersection of information systems, data engineering, and web development, and gave me hands-on experience with a real pharmacy information system.
2. Context & System Overview
SijilPharma Information System
SijilPharma is the ERP used by the pharmacy to manage daily operations: sales and invoicing, purchases and suppliers, stock levels, pricing and margins. It relies on a transactional MySQL schema with normalized tables such as PRODUITS, VENTES, VENTESENTRIES, VENTE_ENTRY_QUANTITIES, and PHARMACIENS.
The reporting and future ML pipeline are built on top of this transactional layer. A dedicated SQL view (ml_prepare_data_for_pre_processing_view) aggregates sales by day, product, and pharmacist, and acts as a bridge between the OLTP database and analytical workloads.
Initially, reporting was manual and non-automated, there was no forecasting, and historical data was under-used. Decisions about purchasing and stock management relied mainly on pharmacist experience.
SI Overview — Pharmacy Information System
High-level overview of the pharmacy information system and the role of SijilPharma within the daily workflow.
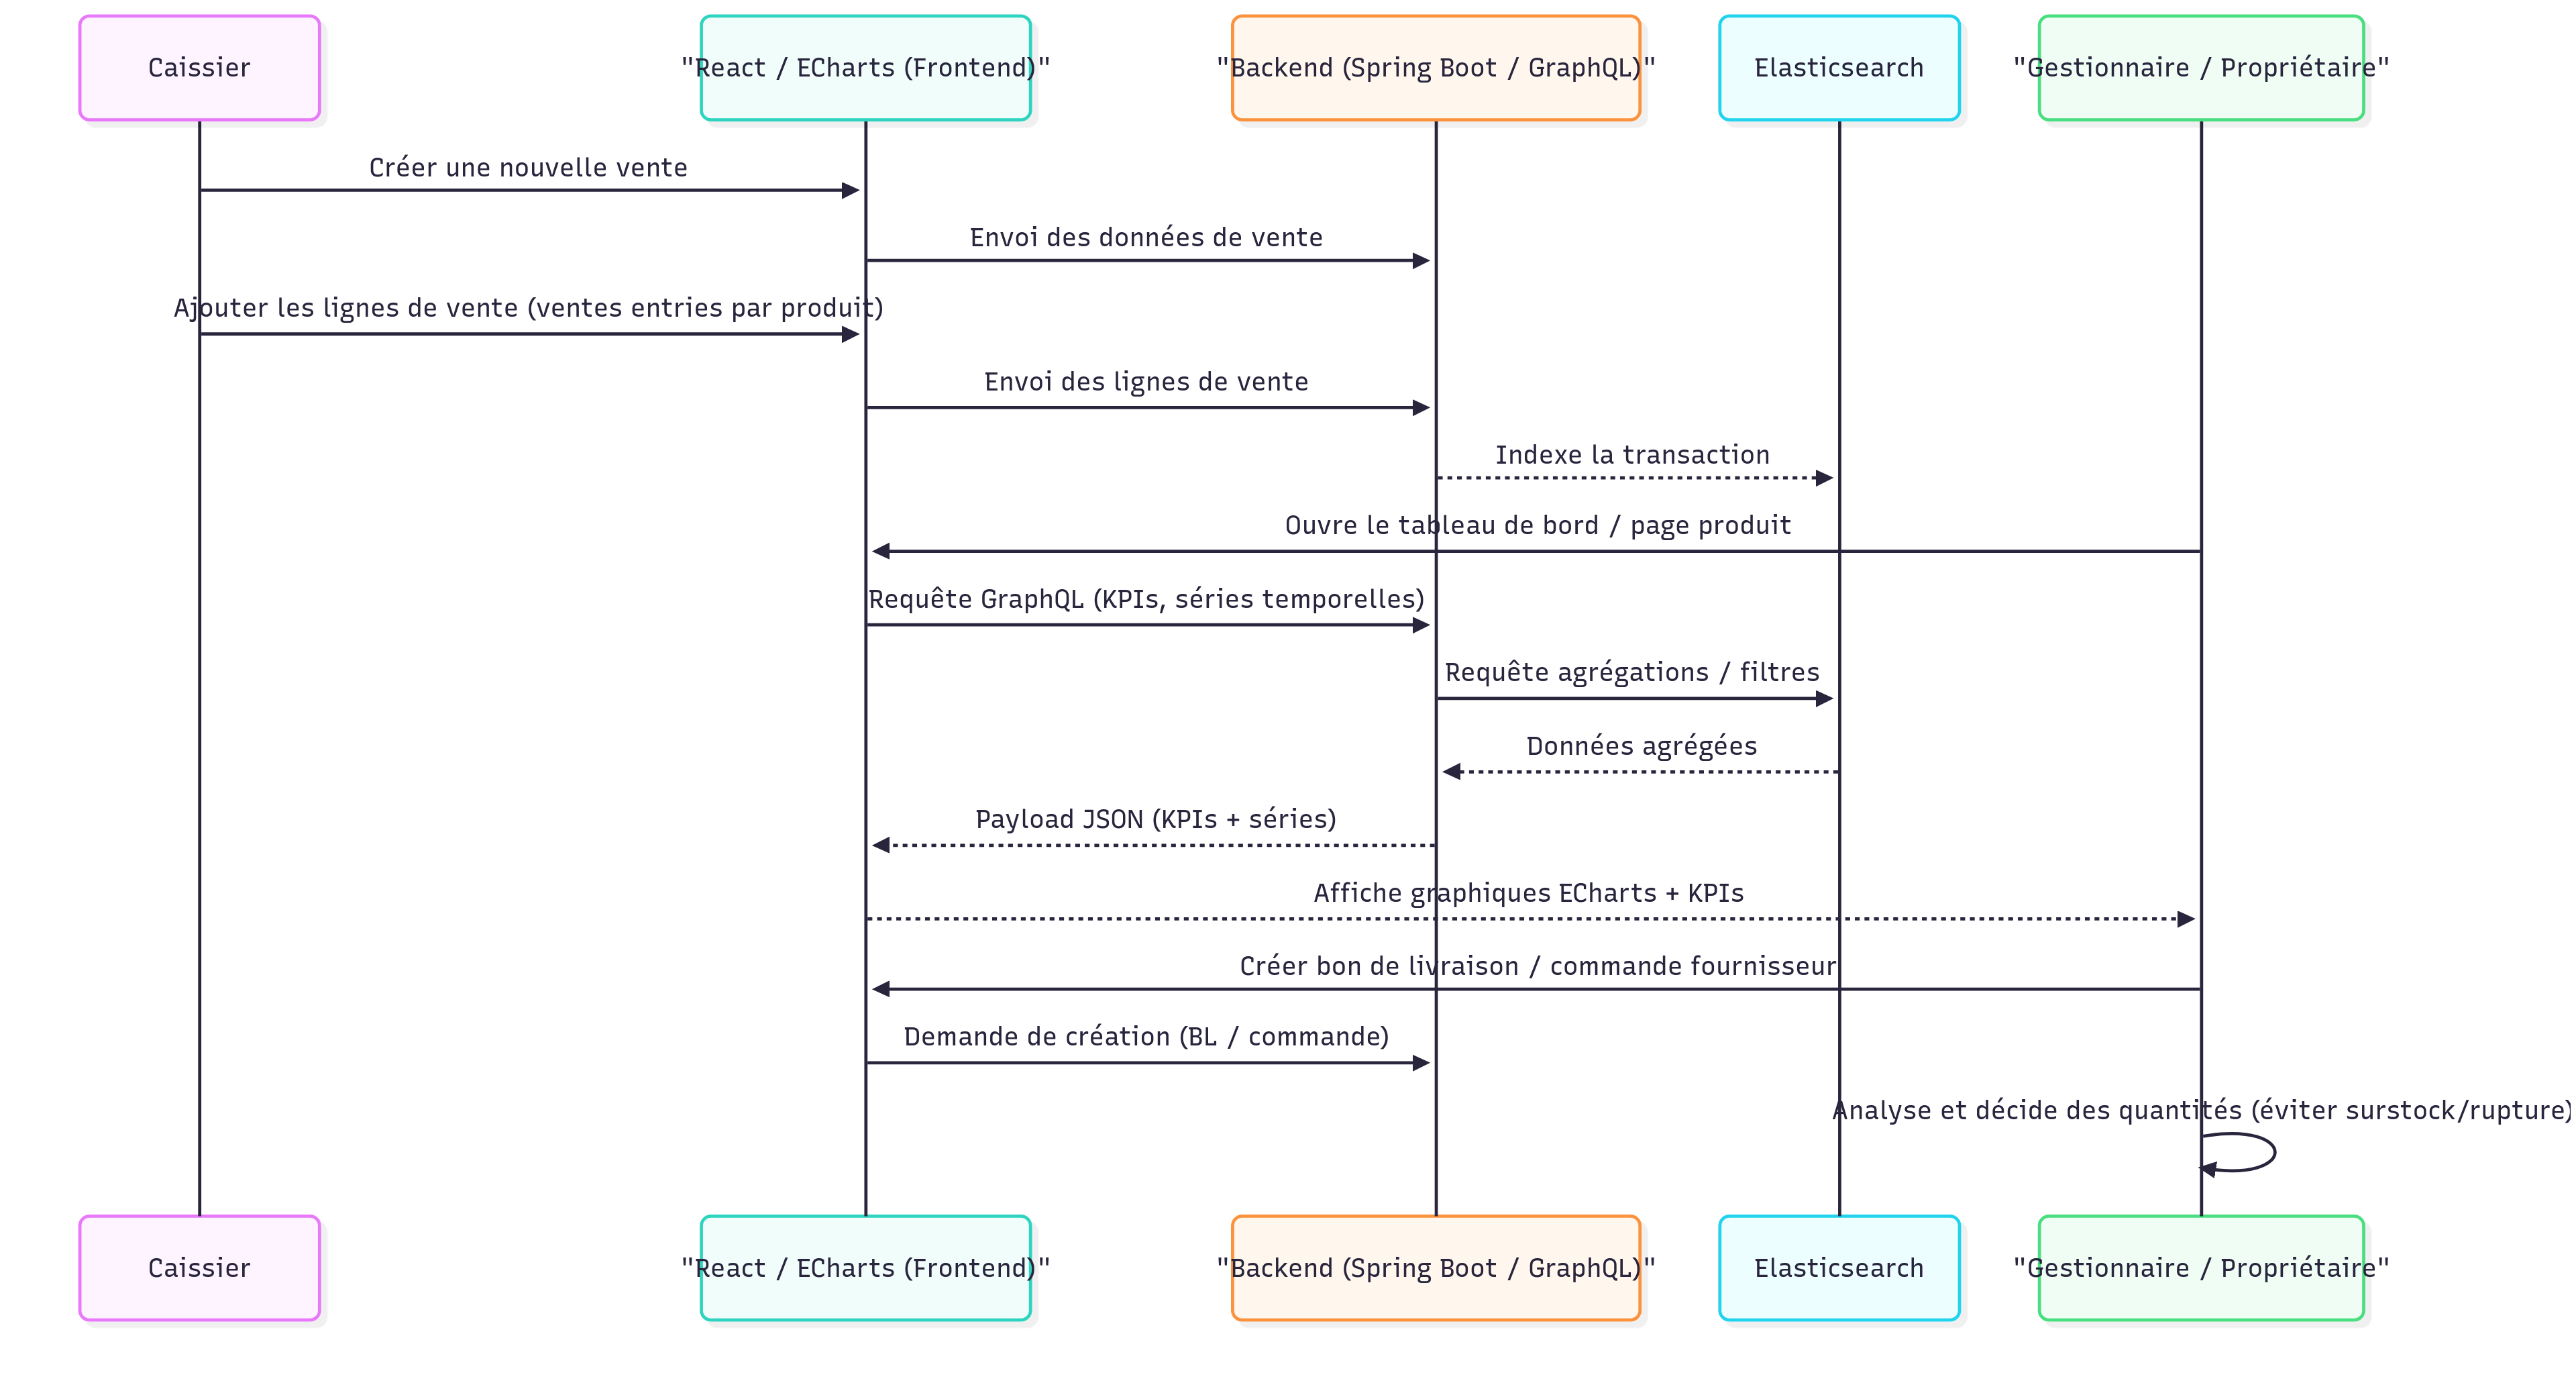
Use Case Flow — From Prescription to Reporting
Main use case flow from prescription and sales to reporting and decision-making.
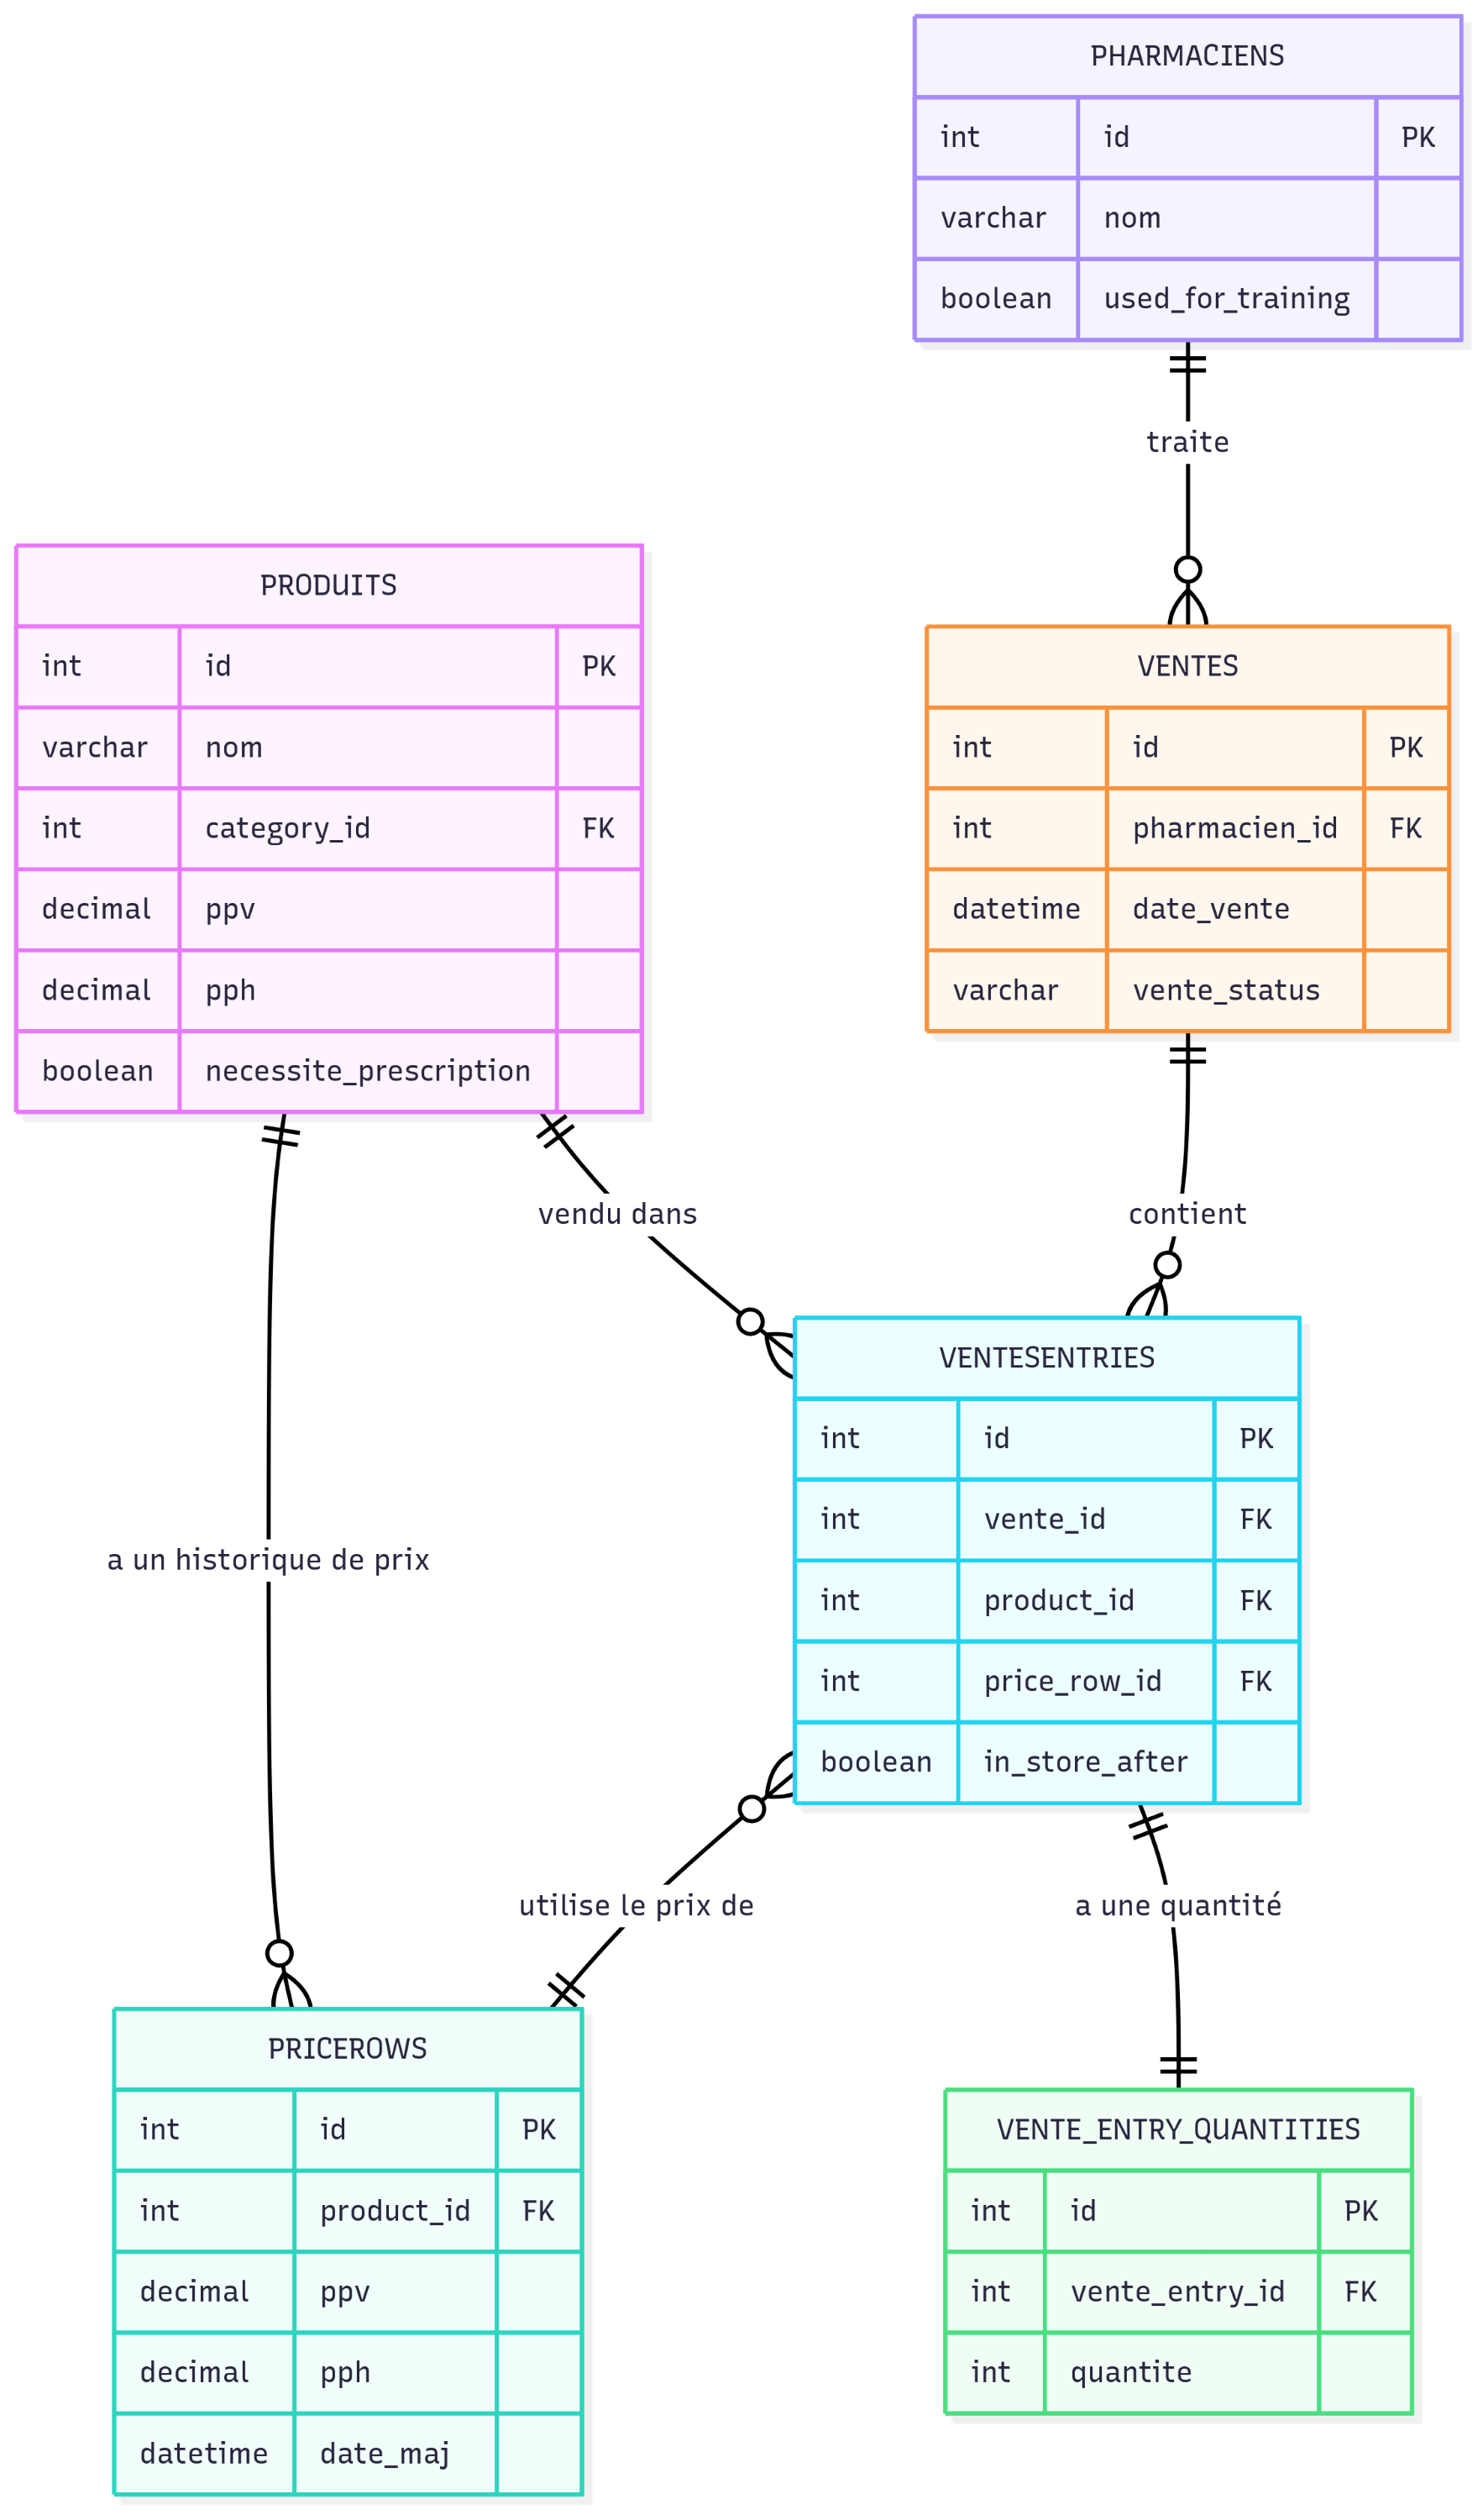
Data Model — Core ERD
Entity–relationship diagram of the main SijilPharma tables used by the reporting and ETL pipeline.
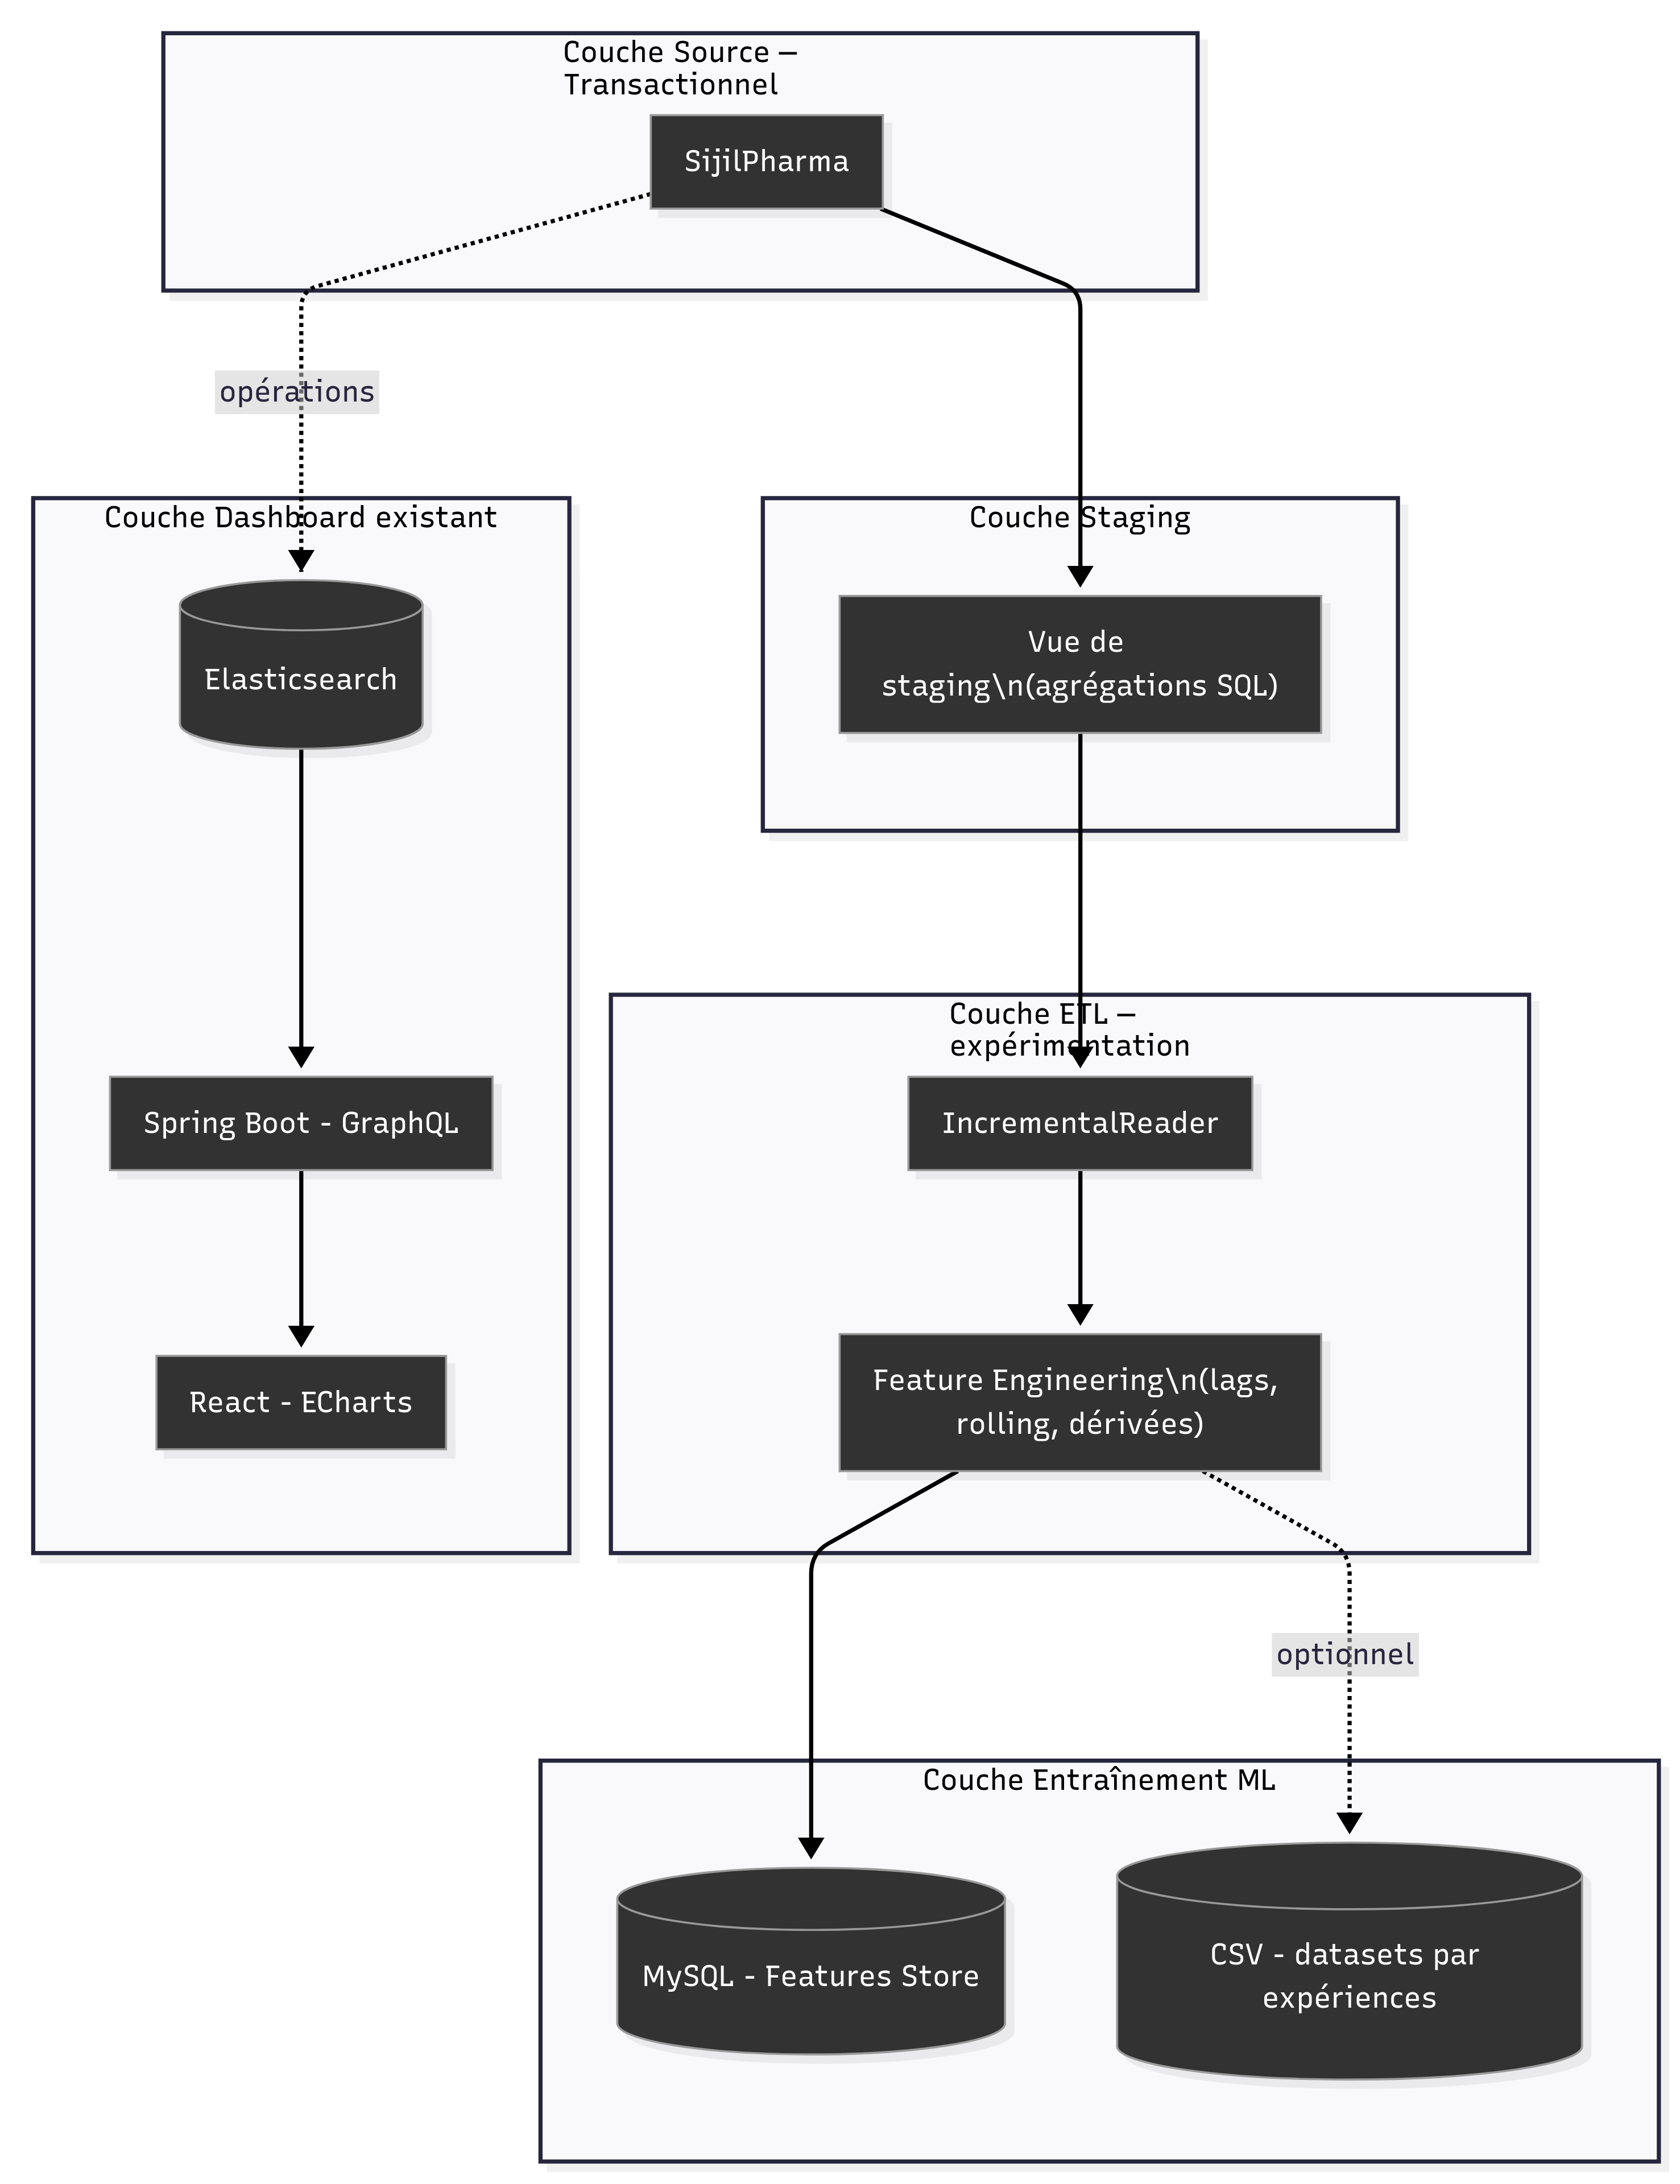
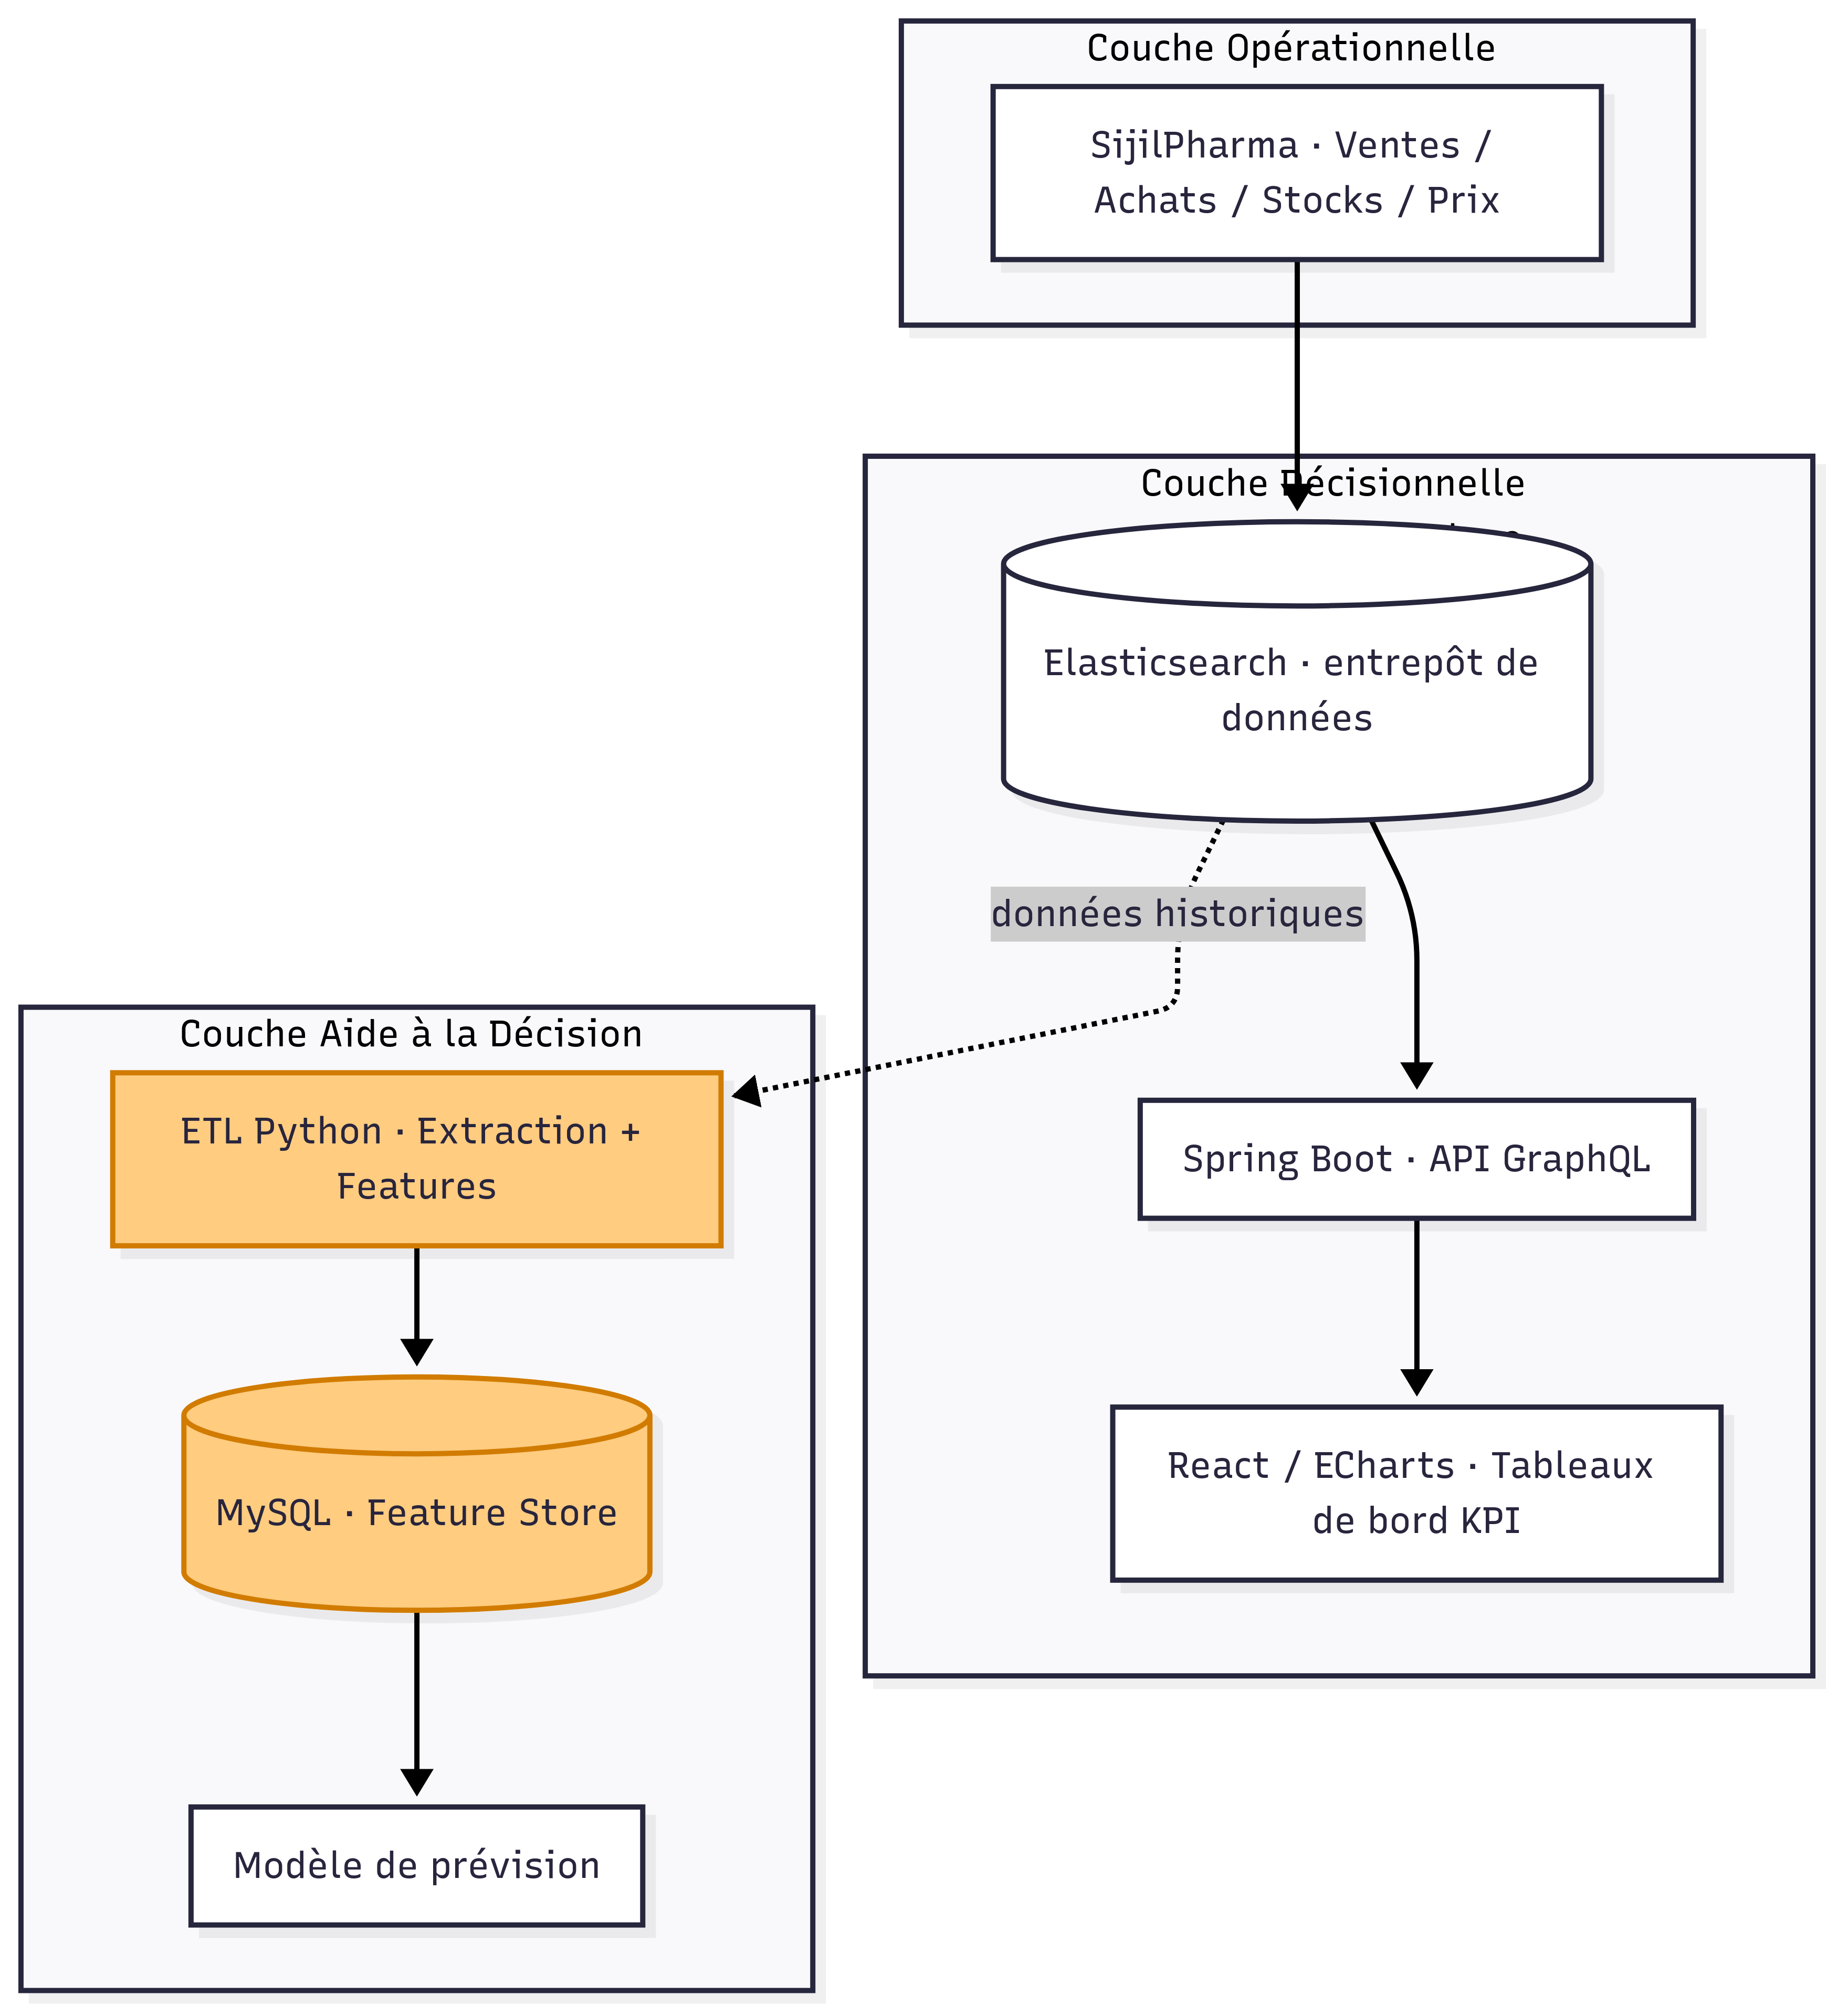
Multi-layer Architecture — Transactional to Analytics
Logical multi-layer architecture, from the transactional database up to the analytics and forecasting layers.
3. KPI Dashboard Redesign
Modernisation des Rapports
3.1 Initial reports — before redesign
The existing “Reports” section exposed basic statistics on sales, purchases, stock, and revenue. However, the layout was dense, the visuals were simple, and filters were limited, making it hard for pharmacists to quickly answer practical questions about performance and stock levels.
Before — Global reports
Initial global reports with basic tables and limited visualisation.
Before — Product detail page
Old version of the product detail report with limited KPIs.
Before — Pie chart report
Legacy pie chart representation with little interaction or drill-down.
3.2 Design improvements — new KPI dashboard
I redesigned the dashboard layout to be more responsive and readable, introduced consistent colors and icons per report type, and added KPI cards summarizing key metrics such as revenue, margins, quantities, and stock rotation. Dynamic filters allow pharmacists to slice by period, pharmacist, or product.
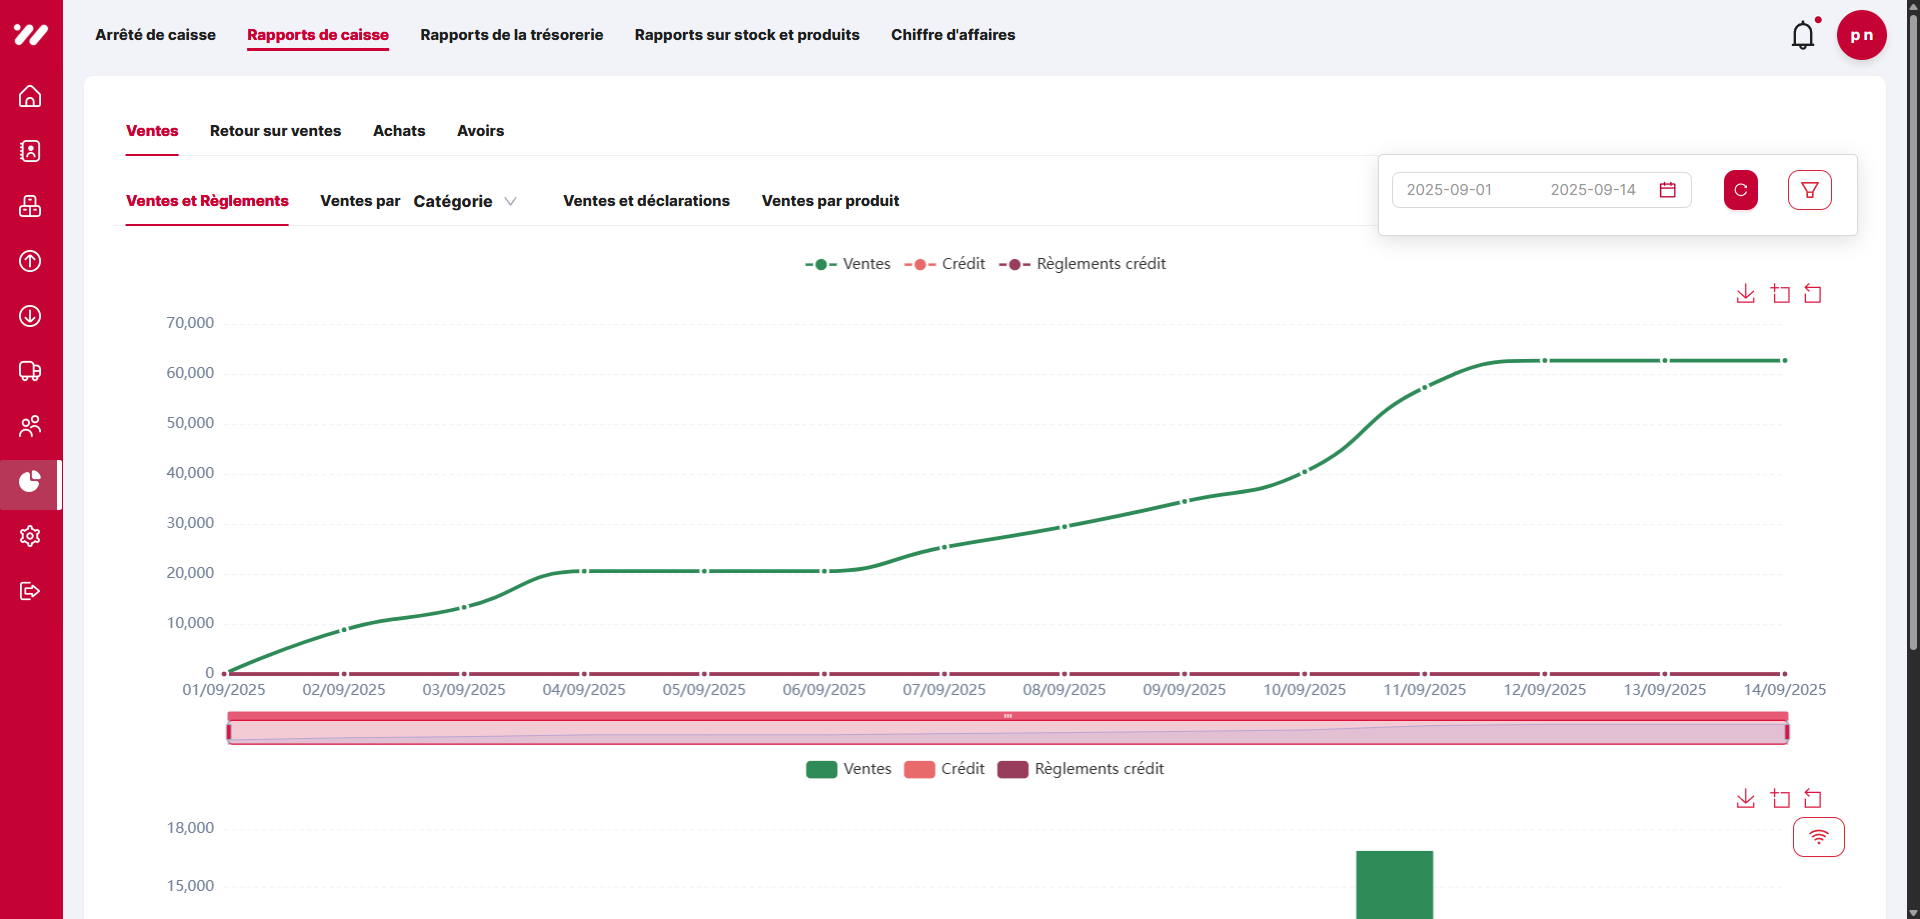
After — Global reports
New global KPI dashboard with clearer layout and consistent visual language.
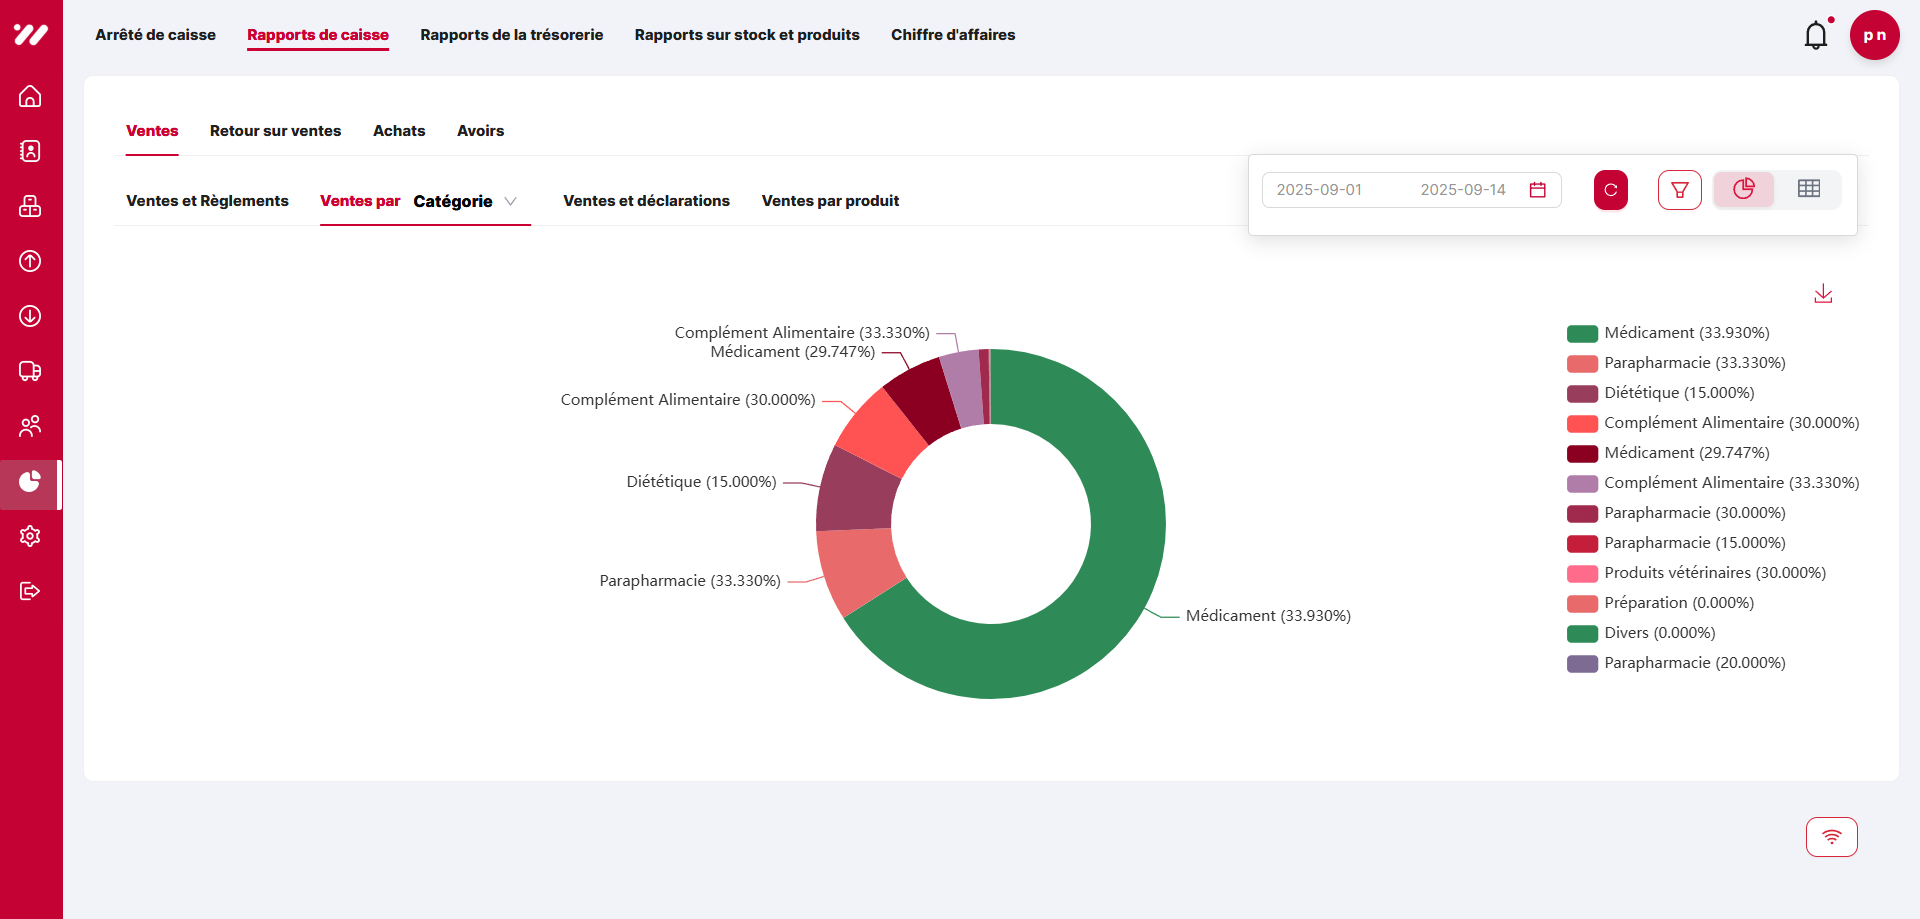
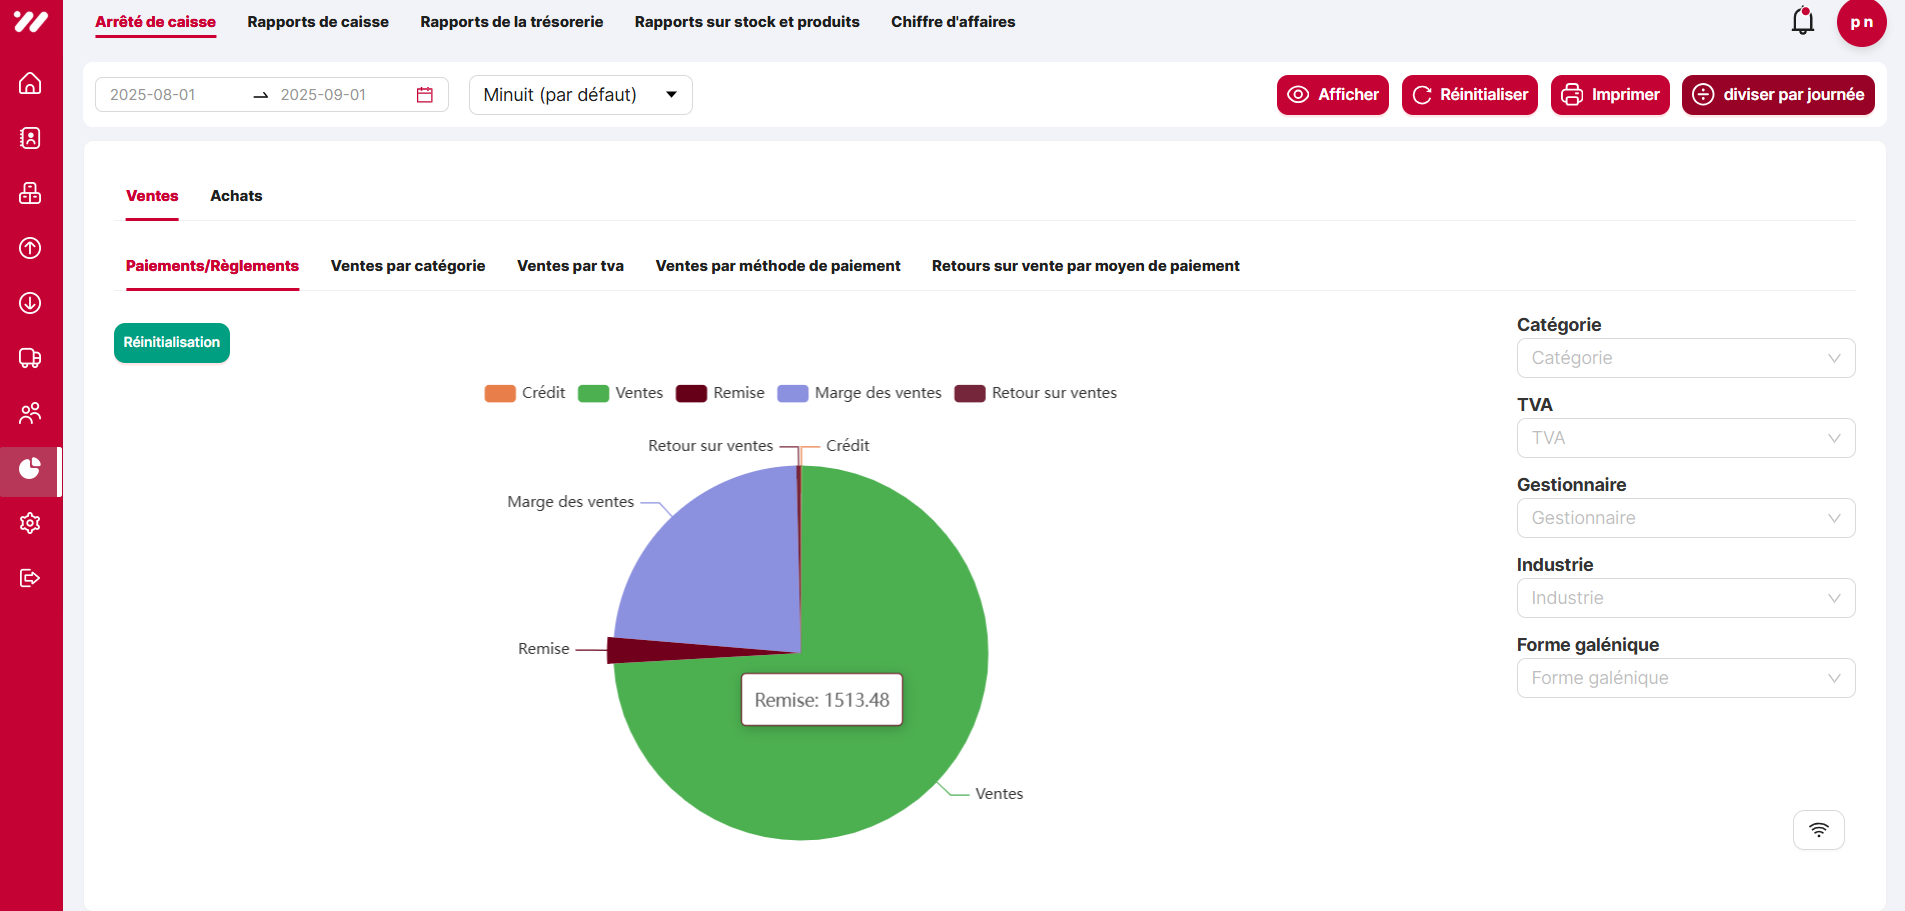
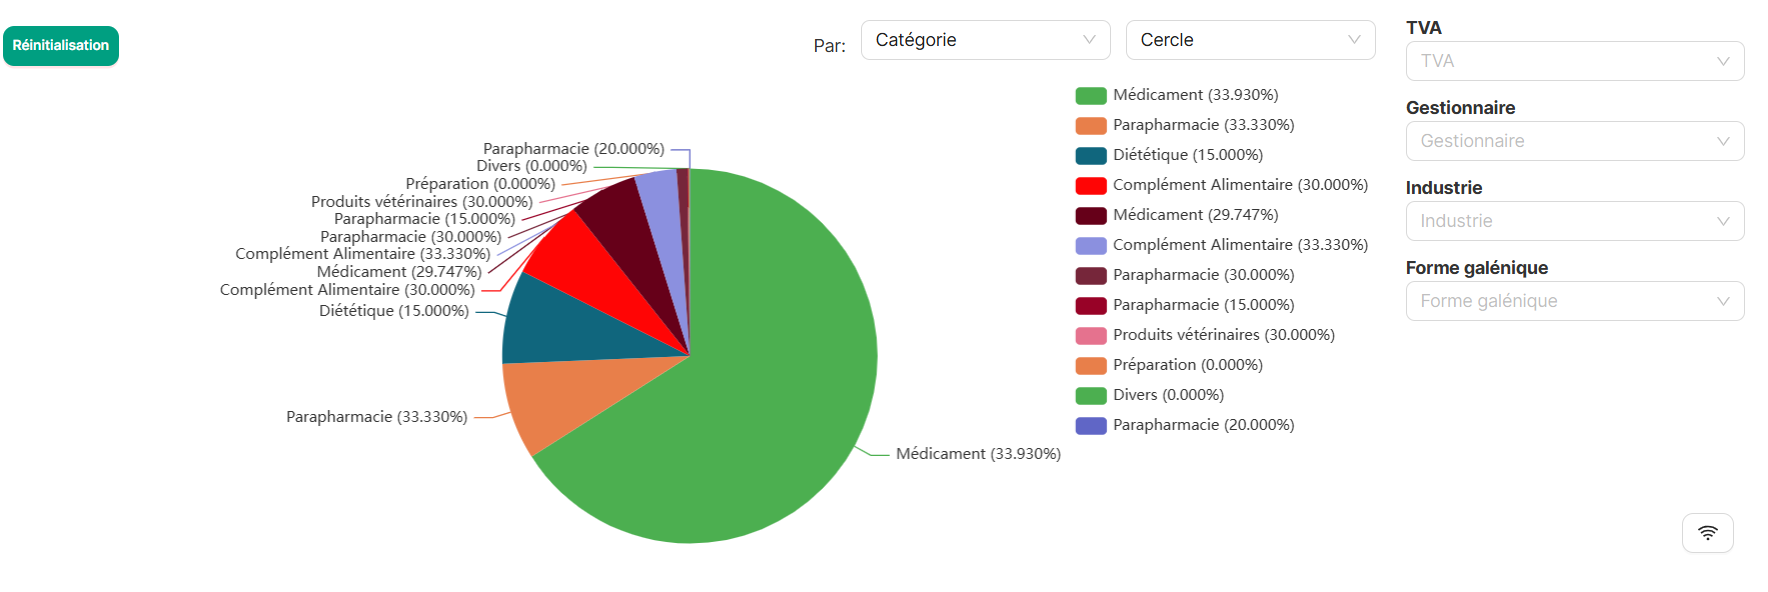
After — Pie chart report
Updated pie chart report with improved colors and better emphasis on key categories.
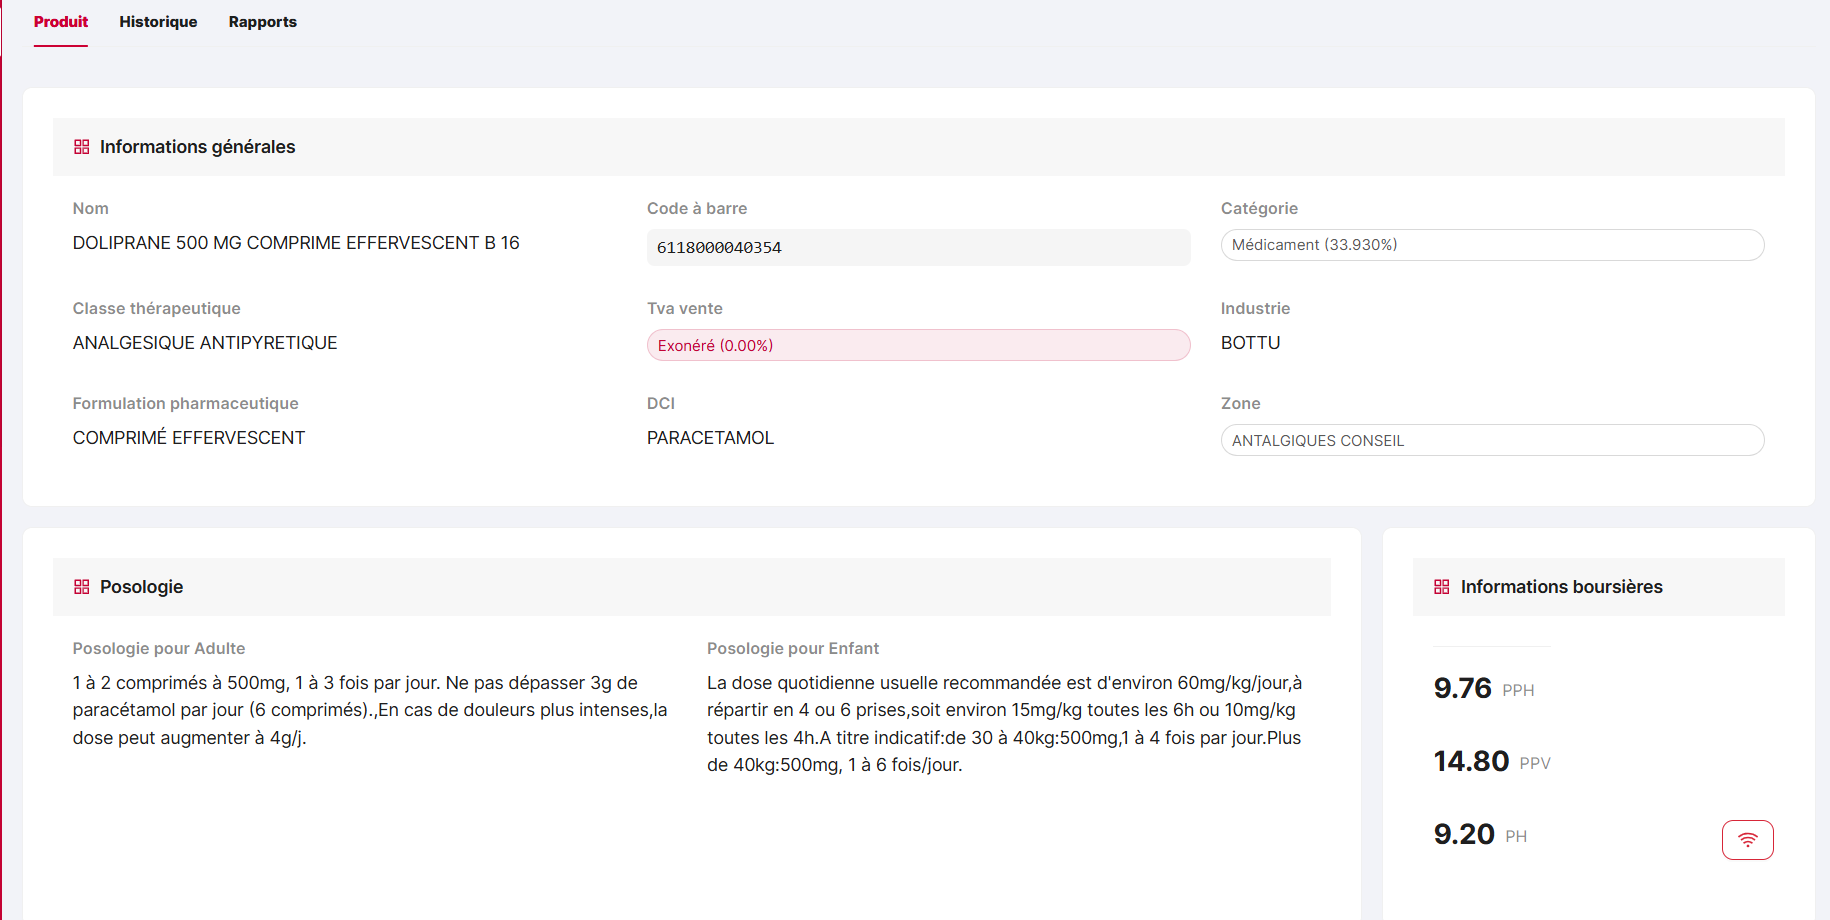
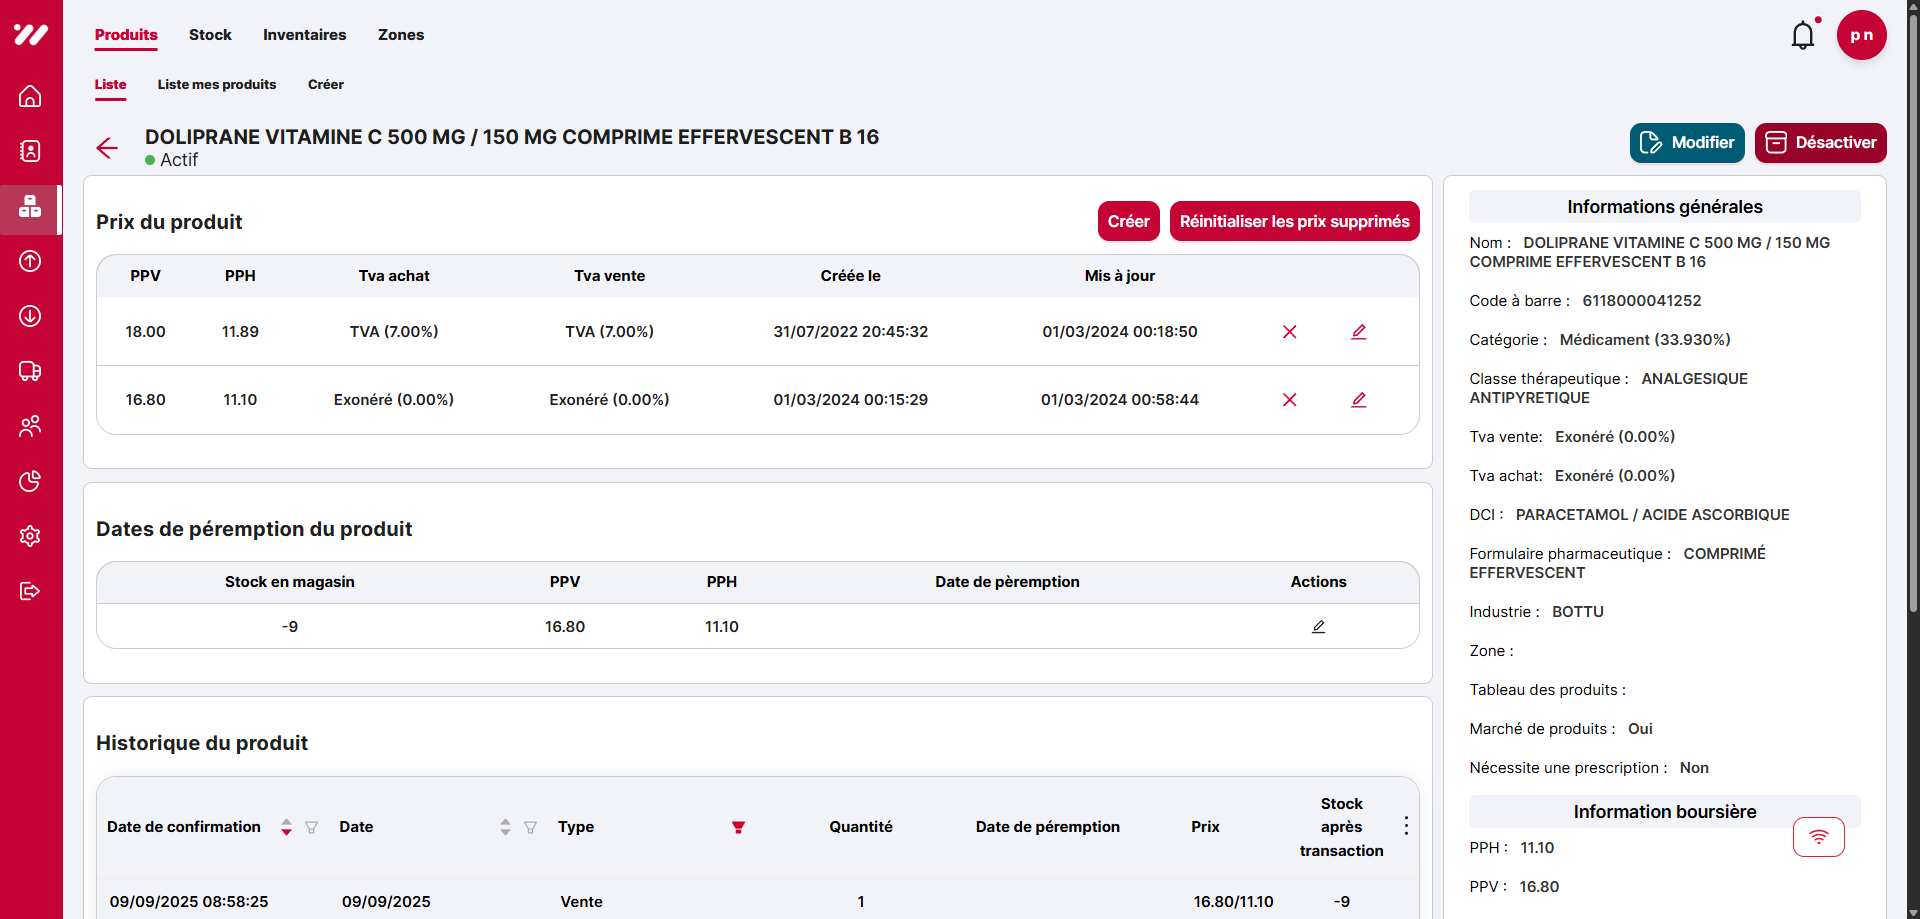
After — Product detail layout
New product detail layout highlighting product-level KPIs and timeseries.
3.3 Product detail page — new charts
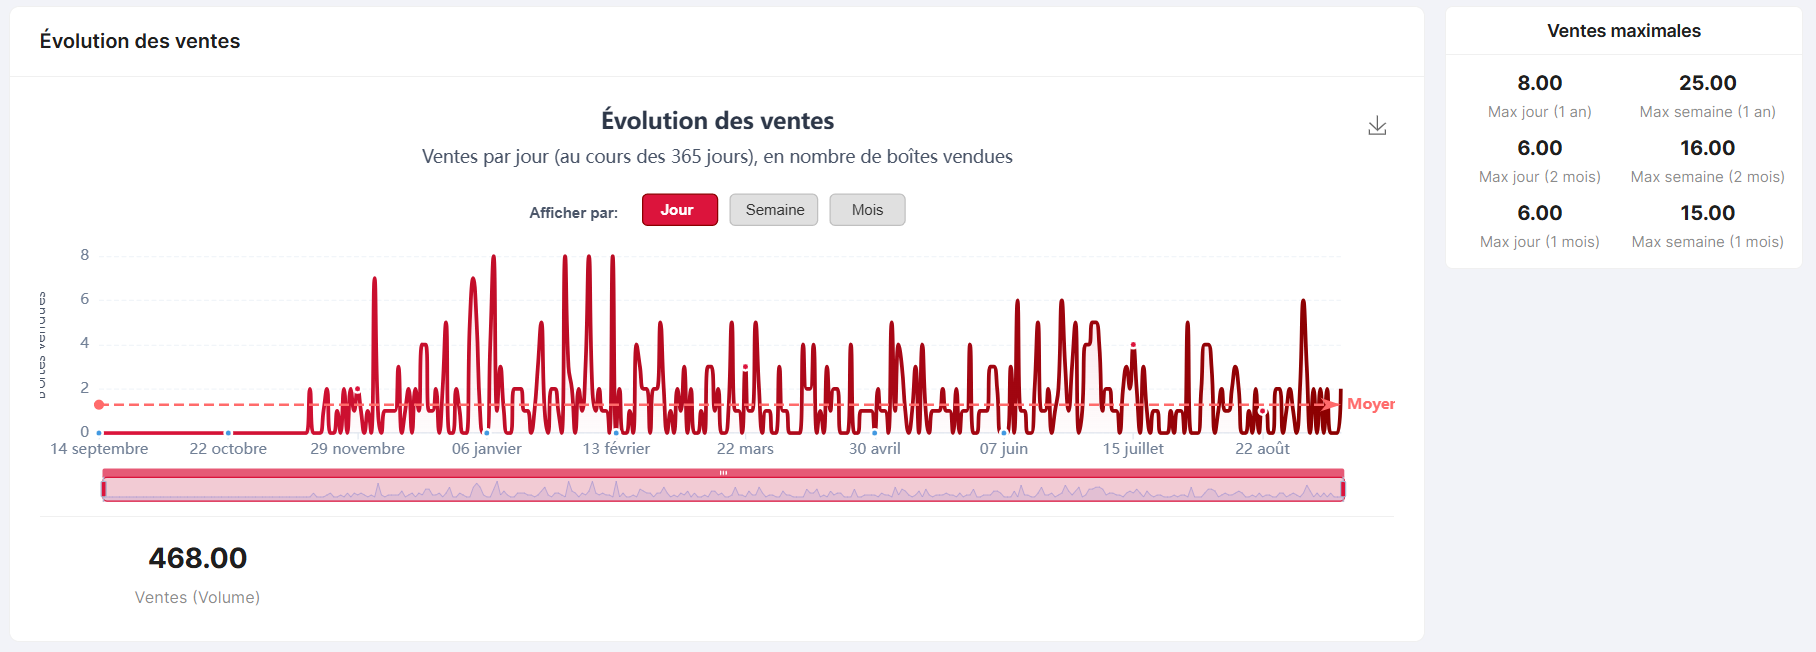
On the product detail page, I added new ECharts graphs showing, for the logged-in pharmacist: sales evolution, stock evolution, purchases evolution, and key KPIs such as commercial margin, stock rotation, and average stock duration. These charts are powered by an existing GraphQL query (productReport) and respect the security and multi-tenant design of the system.
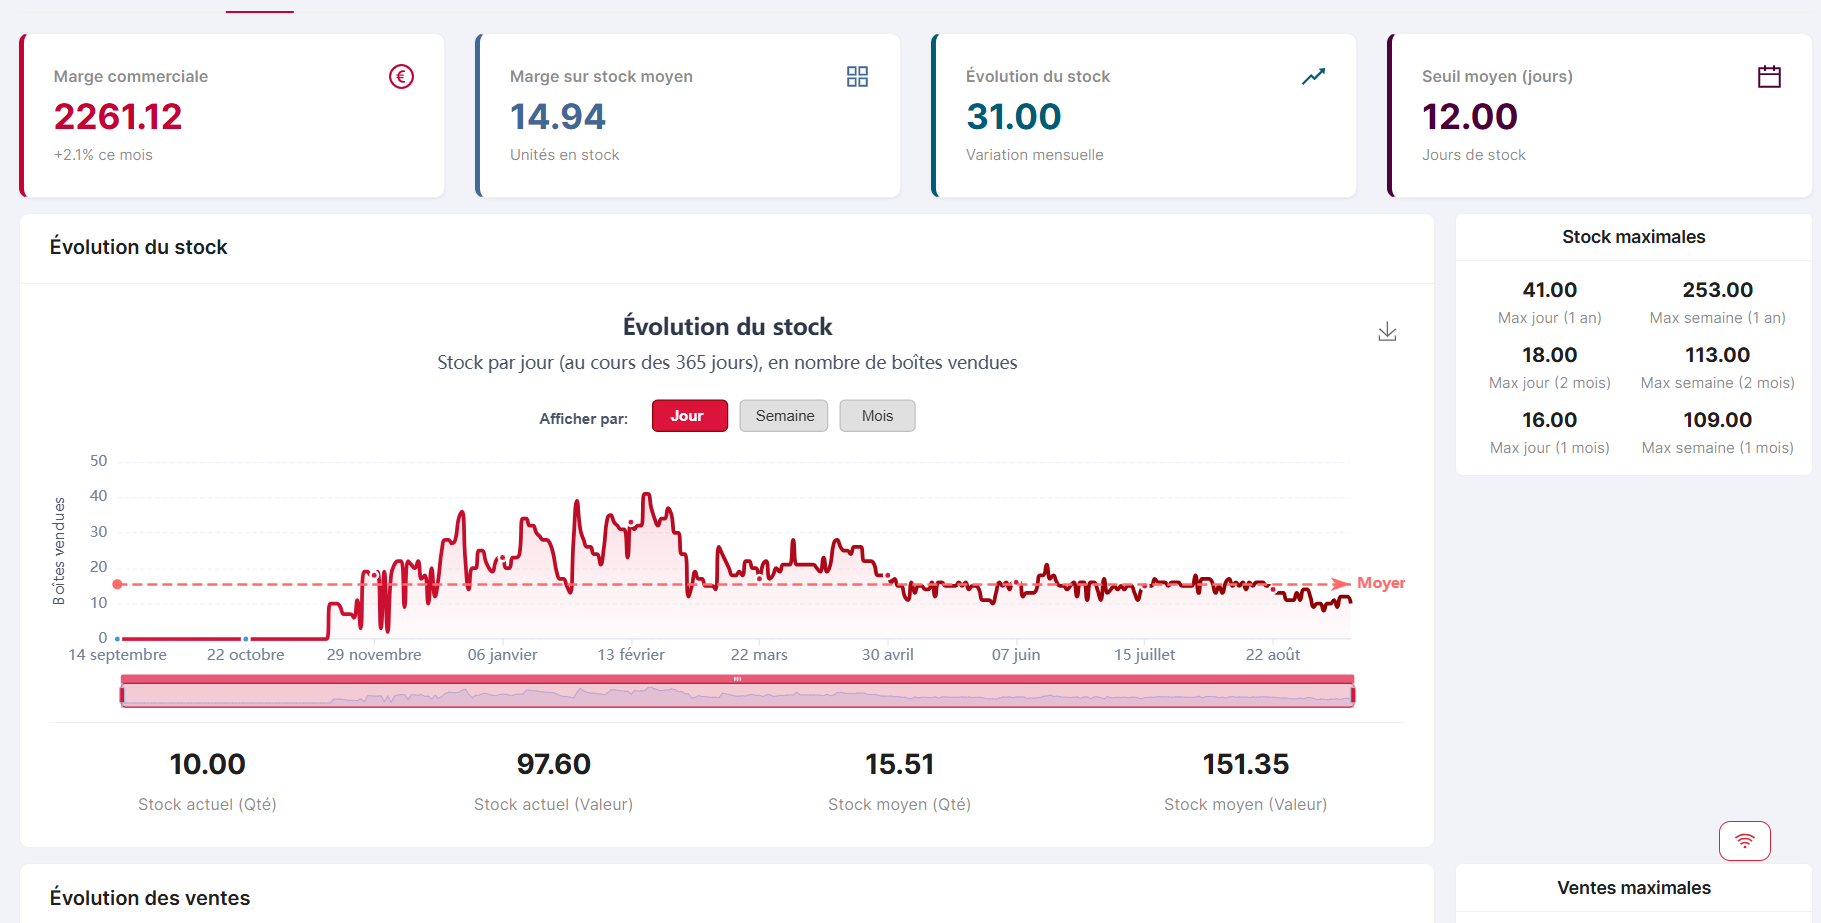
New product chart — Sales & stock
Timeseries visualisation of product sales and stock evolution.
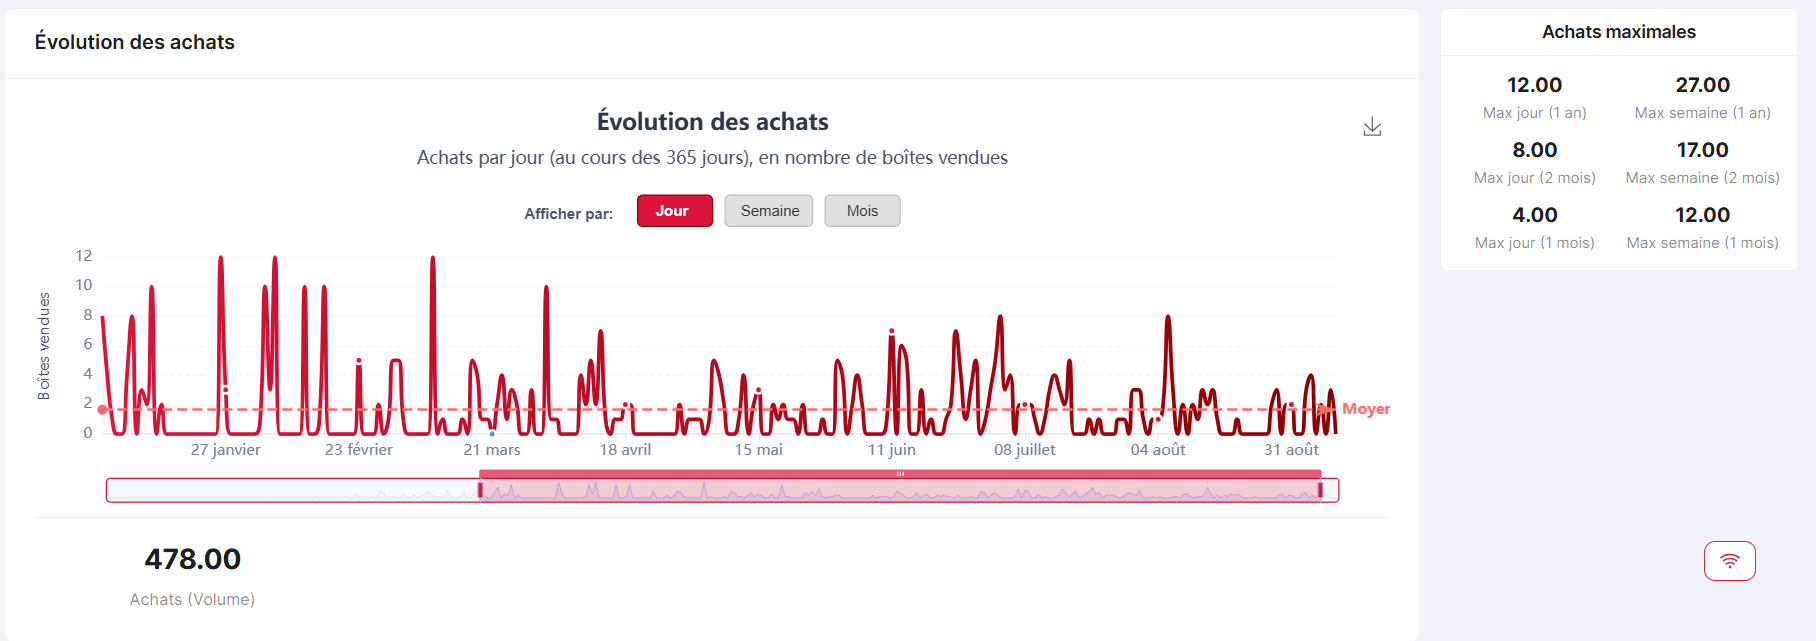
New product chart — Purchases
Purchases evolution and deliveries volume for a given product.
New product chart — KPIs
Product-level KPIs such as margin, rotation, and average stock.
4. Experimental ETL & Feature Engineering
ML Preparation Pipeline
4.1 Architecture — local experimentation
In parallel to the production dashboard, I designed a local ETL pipeline that reads from a persisted view (ml_prepare_data_for_pre_processing_view_persisted) in MySQL, performs transformations and feature engineering, and writes structured CSV datasets to an experiments/ directory with daily, weekly, and monthly granularities.
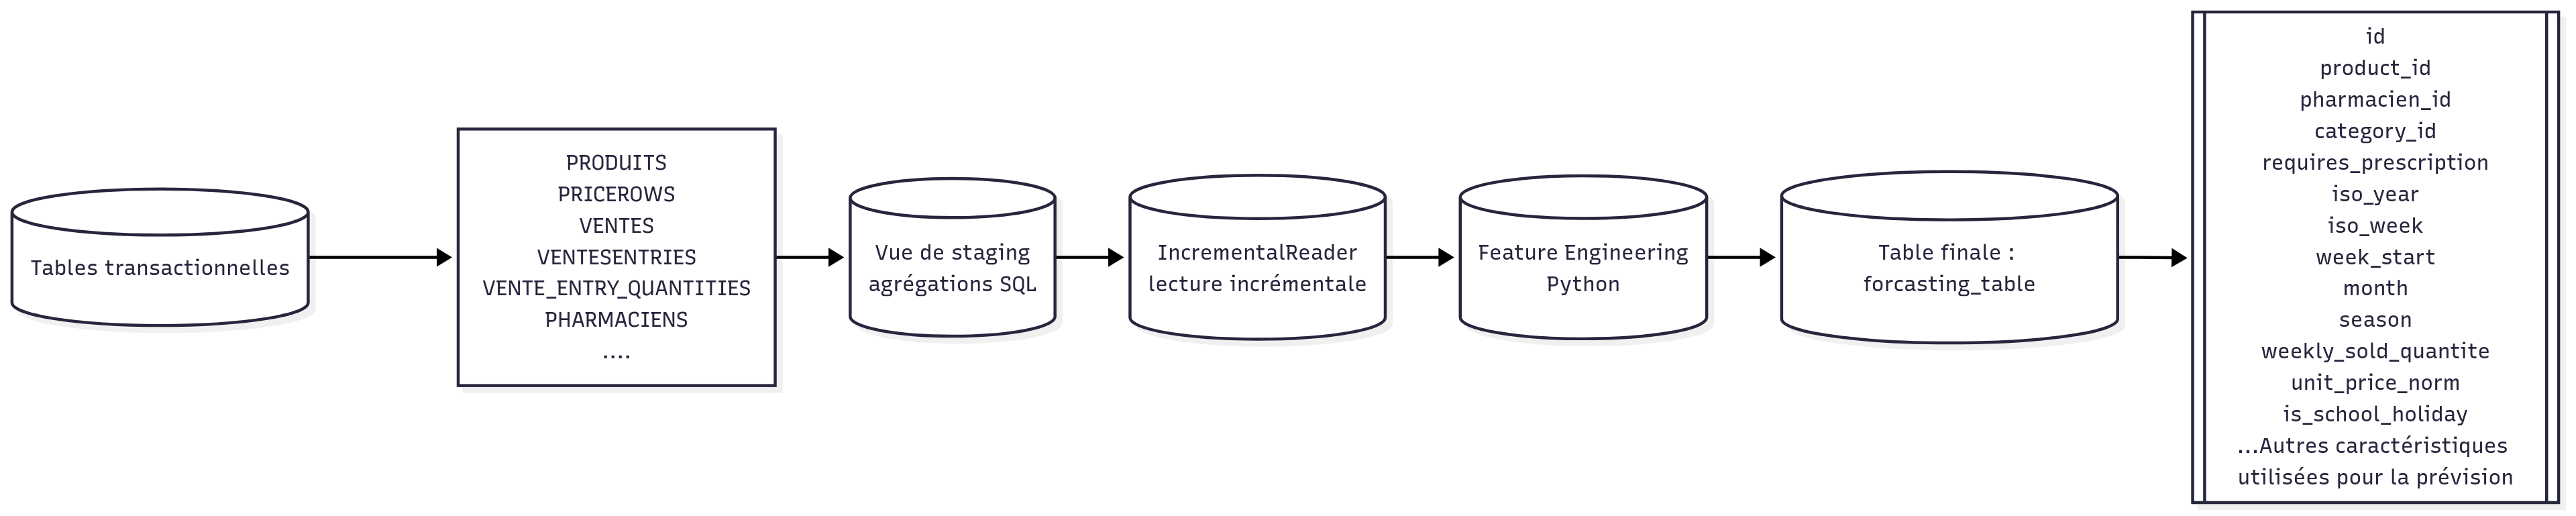
ETL Pipeline — High-level view
High-level architecture of the incremental ETL and feature engineering pipeline.

ETL Pipeline — Detailed schema
Detailed ETL schema highlighting the main components and data flows.
4.2 Incremental extraction — watermark strategy
The IncrementalReader reads only new sales since the last processed ID (max_vente_entry_id) and applies a 30-day lookback window per (pharmacien_id, product_id) pair. A small state manager tracks the last processed watermark and ensures idempotent, append-only ingestion into the feature datasets.
On top of the raw aggregated metrics (sold_quantite, unit_price, cost_price, revenue), the pipeline adds calendar features (day/week/month, weekend flags), lag features, rolling statistics, and derived metrics such as unit margin and volatility.
Experiments organisation
Each experiment is stored with its dataset and a JSON metadata file:
experiments/
  daily/2025-08-03_15-20-11_features-v1/
    ├─ dataset.csv
    └─ meta.json
  weekly/2025-08-05_10-02-47_features-v2/
    ├─ dataset.csv
    └─ meta.json
  monthly/2025-08-07_19-33-05_features-v1/
    ├─ dataset.csv
    └─ meta.json
5. Tests, Validation & Data Quality
Data Quality & Validation
I implemented a small but robust testing strategy around the experimental pipeline to guarantee that generated datasets respect both the expected schema and key business rules. Tests cover column names and types, absence of negative stocks or future dates, and the correctness of derived features such as revenue.
Additional checks validate that experiment folders contain both dataset.csv and meta.json, that metadata columns match the CSV, and that there are no duplicate rows per (sale_date, product_id, pharmacien_id).
Example tests
- Schema and type checks (dates, quantities, prices).
- Business rules: non-negative stock and quantities.
- Revenue consistency with
sold_quantite,unit_price, andcost_price. - Feature quality: lags and rolling windows non-empty.
Sample results
- Daily dataset: ~128k rows, 463 products, 2023–2025, ~95 MB.
- Weekly dataset: ~8.7k rows, 451 products, ~11 MB.
- Monthly dataset: ~1.2k rows, 430 products, ~2 MB.
- Missing values < 3.5% daily, < 1% weekly.
6. Impact & Learnings
Bilan du Projet
Production impact
- Report generation time reduced from manual workflows (~2h) to automated dashboards (< 1 minute).
- Improved visibility on product performance, stock levels, and margins for pharmacists.
- Consistent visual language makes it easier to interpret complex KPIs quickly.
Experimental impact
- Clean feature datasets ready for future ML experiments.
- Incremental ETL architecture with clear watermarking and traceability.
- Reproducible experiments through structured folders and metadata.
What I learned
- Understanding the domain and constraints of a real pharmacy information system.
- Working inside an existing Spring Boot / GraphQL / Elasticsearch / React codebase.
- Designing incremental ETL pipelines and feature stores with a testing mindset.
- Communicating with business users and translating needs into technical choices.
7. Tech Stack & Skills
Tech
- MySQL (transactional database and feature views)
- Spring Boot + GraphQL + Elasticsearch
- React + ECharts for dashboards
- Python, Pandas, SQLAlchemy for ETL
- Pytest and JSON metadata for validation
- GitHub for version control and collaboration
Skills
- Data engineering and incremental ETL design.
- Feature engineering at multiple granularities.
- Dashboard UX and KPI design.
- Testing, data quality, and reproducibility.
- Working with production systems and real users.
8. Future Work
Perspectives
- Short term: enrich the feature catalogue, add automatic descriptive statistics, and include exogenous variables such as holidays or health campaigns.
- Medium term: deploy the ETL to production with feature tables in MySQL, schedule periodic retraining, and expose predictions via GraphQL.
- Long term: build a full decision-support module with demand forecasts, overstock/stockout alerts, and purchasing recommendations for multiple pharmacies.
9. About the Internship
This project was carried out during my initiation internship at Pharmacie SijilPharma, as a 1st year engineering student in Information Systems & Big Data at ENSA Berrechid.
It confirmed my interest in data engineering and in building reliable, useful data systems that connect real-world operations to analytics and future predictive models.