Graph Theory · Data Engineering · Neo4j
Modeling the US Opioid Supply Chain as a Graph
Community detection on the ARCOS dataset using Neo4j & NetworkX
I modeled the US opioid pharmaceutical supply chain as a graph, built a full data pipeline into Neo4j, and applied the Girvan–Newman algorithm to detect 41 communities with strong modular structure (Q = 0.586).
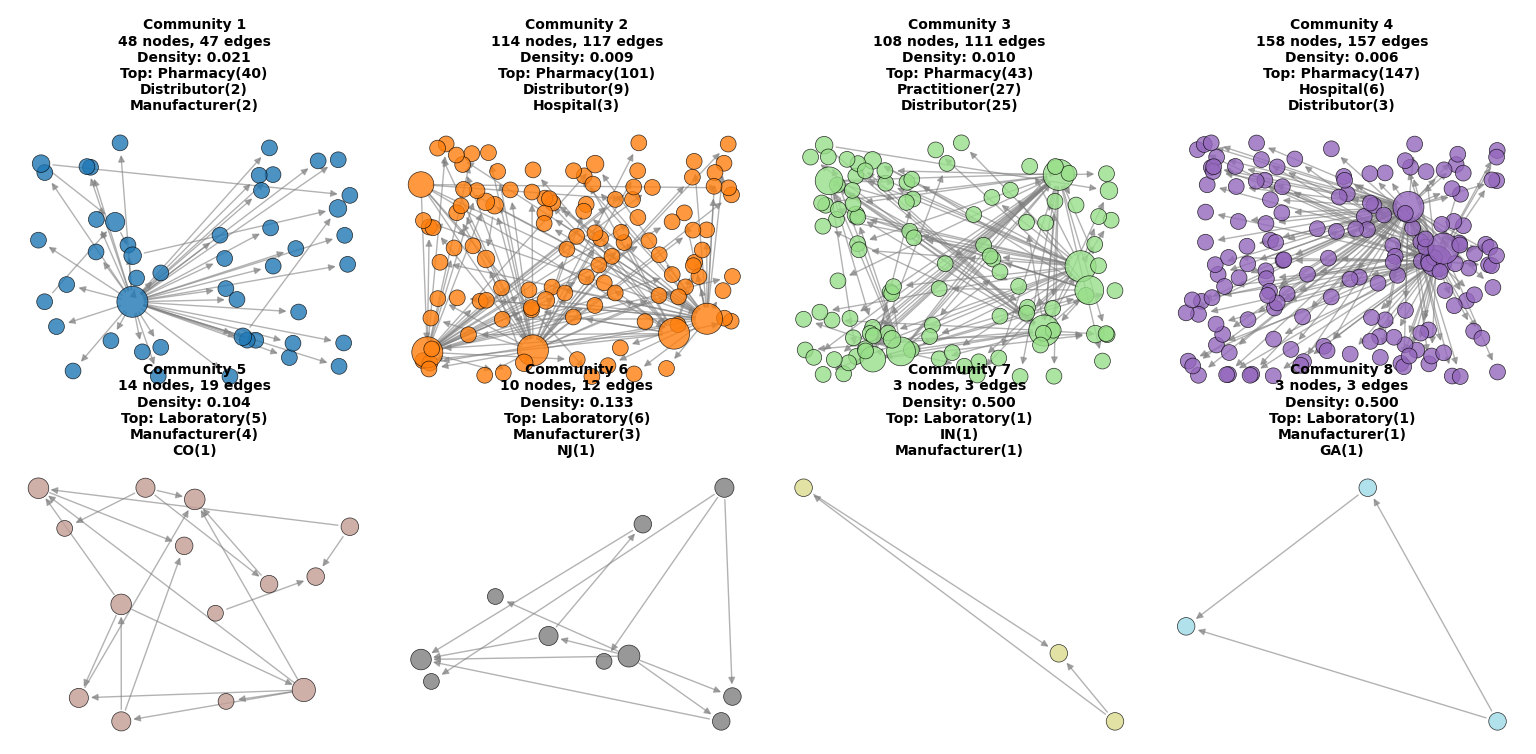
Figure A — First glimpse of the community structure in the opioid supply chain graph: large diffuse clusters represent broad distribution networks, while smaller dense clusters illustrate specialized functional groups.
1. Overview
Résumé Exécutif
This project analyzes the US opioid pharmaceutical supply chain as a graph using the public ARCOS dataset from the DEA. The goal is to make the underlying structure of the distribution network visible and measurable.
I designed a graph data model in Neo4j, built a Python-based data pipeline, and applied the Girvan–Newman community detection algorithm (via NetworkX) to uncover structural patterns and critical nodes in the supply chain.
On a cleaned, representative subgraph of 1,346 nodes and 1,331 edges, the analysis identified 41 communities with an optimal modularity of 0.586, revealing a strongly structured network dominated by distributors acting as critical bottlenecks.
Nodes analyzed
1,346
Edges
1,331
Communities
41
Best modularity
0.586
2. Context & Problem
Introduction et Contexte
The opioid crisis in the United States exposed how vulnerable and opaque pharmaceutical supply chains can be. Millions of transactions, thousands of actors (manufacturers, distributors, pharmacies, hospitals), and highly regulated substances make it difficult to understand where the real risks lie.
Traditional relational databases struggle to capture the web of interactions between entities, products, and locations. Graph theory offers a natural way to model flows, bottlenecks, and structural communities inside the supply chain, making it possible to reason about risk and resilience at the network level.
3. Objectives
Objectifs du Projet
The project was structured around four concrete objectives:
- Design a graph database model of the opioid supply chain in Neo4j.
- Build a robust data pipeline from raw ARCOS records to a clean graph representation.
- Apply community detection (Girvan–Newman) to uncover structural communities in the network.
- Identify critical nodes using centrality and interpret them in terms of risk and regulation.
4. Data & Sampling
Source des Données
The analysis is based on the public ARCOS dataset released by the US Drug Enforcement Administration (DEA), covering controlled opioid shipments between 2006 and 2014. The dataset contains millions of transaction-level records across thousands of entities.
Working directly on the full dataset is computationally expensive, especially for community detection algorithms like Girvan–Newman. I therefore selected a sample of 150 products to construct a representative subgraph that preserves the structural patterns while keeping the problem tractable.
After cleaning, removing isolates, and focusing on the largest connected component, the final graph used for analysis contained 1,346 nodes and 1,331 edges.
Sampling allows the graph to stay small enough for iterative community detection and modularity optimization, while still capturing the key structural patterns of the supply chain. The trade-off is between performance and representativity — this project focuses on structural insight rather than full nationwide coverage.
5. Graph Model & Technical Architecture
Modélisation & Architecture Technique
5.1 Graph schema (Neo4j)
The graph model captures entities, products, active ingredients, and locations, as well as shipment relationships between entities:
Nodes
- Entity (labels: Pharmacy, Distributor, Manufacturer, Hospital, Practitioner, etc.)
- Product
- ActiveIngredient
- Location
Relationships
(:Entity)-[:SHIPS_TO]->(:Entity)(:Product)-[:CONTAINS]->(:ActiveIngredient)(:Entity)-[:LOCATED_IN]->(:Location)
5.2 Architecture stack
The technical architecture follows a simple but robust layered structure:
- Data layer: ARCOS CSV files and intermediate JSONL exports.
- Processing layer (Python):
PharmaDataProcessorfor cleaning, mapping, and generating CSVs for import. - Graph layer: Neo4j with APOC procedures for batched import.
- Analysis layer: NetworkX + Matplotlib for community detection and visualization.
Example: mapping commercial activities to Neo4j labels
activity_to_label = {
    "CHAIN PHARMACY": "Pharmacy",
    "INDEPENDENT PHARMACY": "Pharmacy",
    "DISTRIBUTOR": "Distributor",
    "HOSPITAL": "Hospital",
    "PRACTITIONER": "Practitioner",
    "MANUFACTURER": "Manufacturer",
}
6. Analysis Pipeline
Pipeline d’Analyse
The analysis is organized as a four-step pipeline:
- Data processing (PharmaDataProcessor): clean raw ARCOS records, normalize entity identifiers, and generate import-ready CSVs.
- Optimized import into Neo4j: load nodes and relationships using
apoc.periodic.iterateto batch large operations. - Graph extraction & cleaning: extract the shipment graph, convert it to an undirected NetworkX graph, and keep only the largest connected component.
- Community detection & modularity optimization: run Girvan–Newman and track modularity to select the best partition.
Example: Girvan–Newman loop with modularity tracking
import networkx as nx
from networkx.algorithms.community import modularity

# G_analysis is the cleaned, undirected graph
communities_generator = nx.community.girvan_newman(G_analysis)

best_modularity = -1.0
best_partition = None
modularity_evolution = []

max_divisions = 3  # performance constraint
for i, partition in enumerate(communities_generator):
    if i >= max_divisions:
        break

    current_modularity = modularity(G_analysis, partition)
    modularity_evolution.append(current_modularity)

    if current_modularity > best_modularity:
        best_modularity = current_modularity
        best_partition = partition
7. Results
Analyse des Résultats
Visualizations of the detected communities show a mix of large, sparse distribution structures and small, dense functional clusters. Even on a sampled graph, the structure is strongly modular.
Figure A — Overview of 8 most dominant communities
Visualization of the 8 largest communities detected by the Girvan–Newman algorithm. Large diffuse clusters represent broad distribution networks, while smaller dense clusters illustrate specialized functional groups.
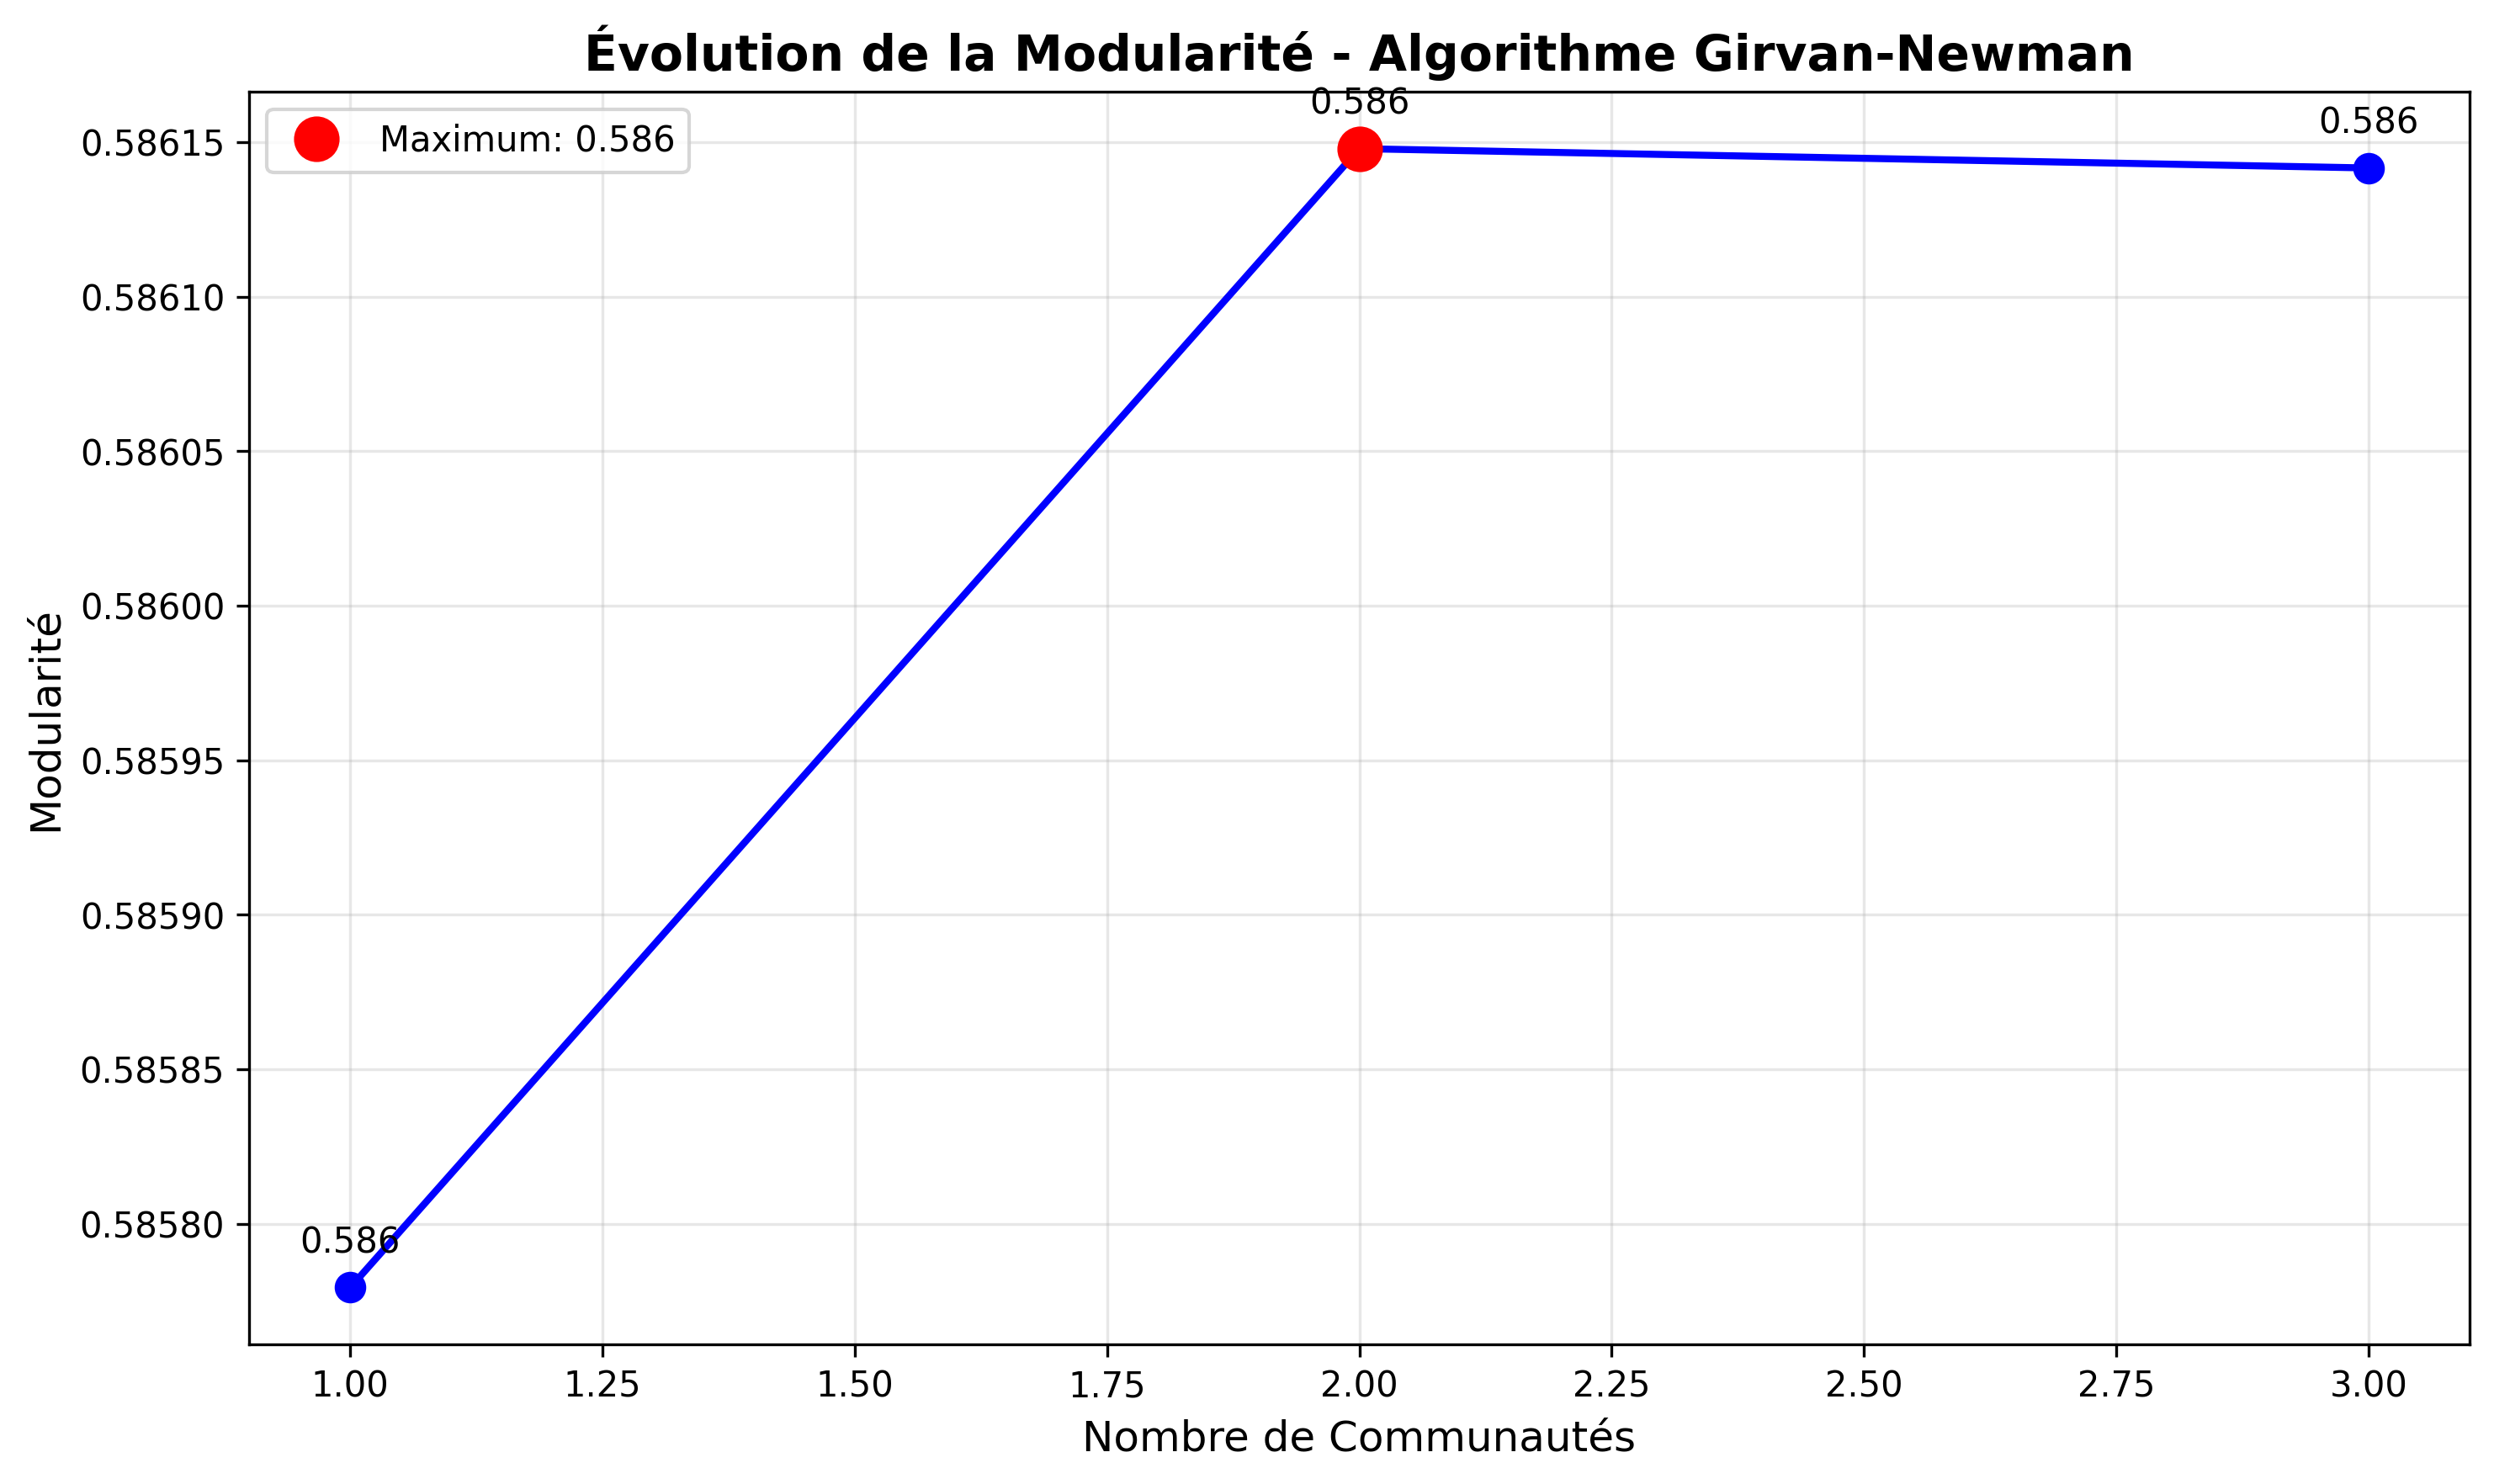
Figure B — Modularity evolution during Girvan–Newman
Evolution of modularity across partitions returned by Girvan–Newman. The maximum modularity of 0.586 corresponds to the optimal community structure with 41 communities.
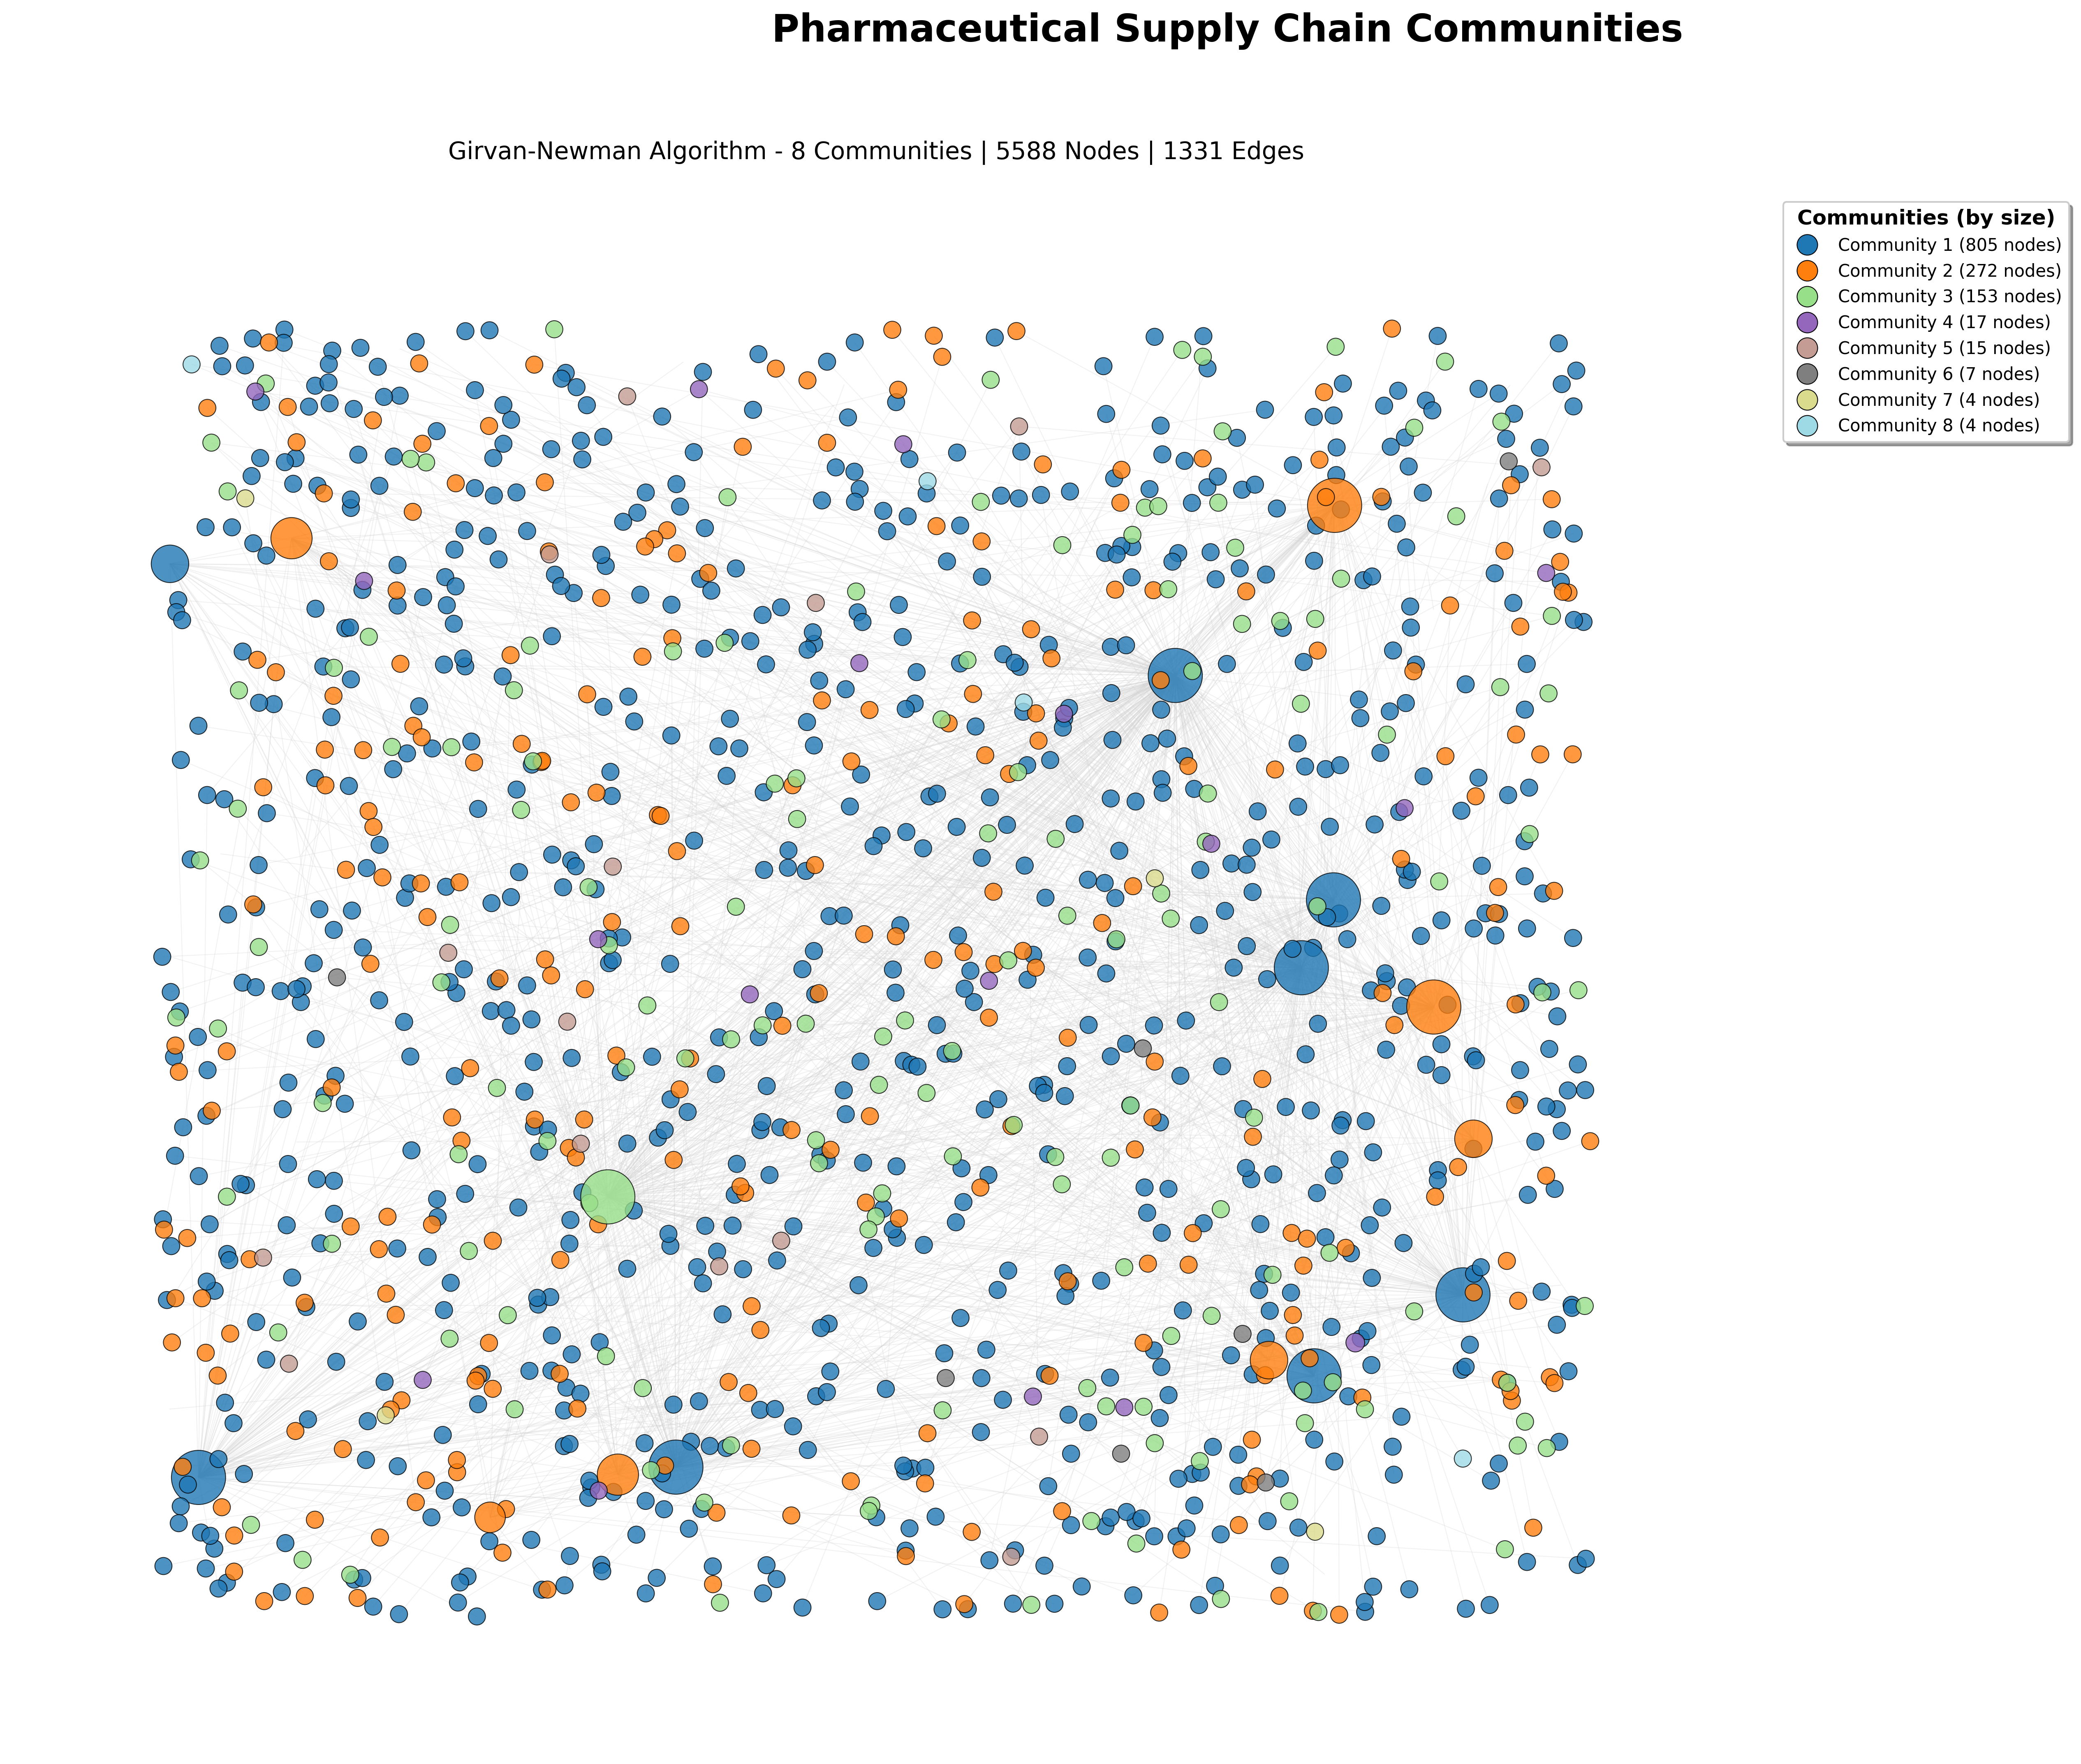
Figure C — Global graph visualization (full extract)
Global view of the extracted pharmaceutical supply chain graph (5,588 nodes, 1,331 edges). Colors indicate community assignments for the 8 largest communities.
Top critical nodes (conceptual)
Using betweenness centrality on the largest connected component, I identified a set of highly central nodes acting as structural bottlenecks. The table below summarizes the main archetypes (names anonymized):
| Archetype | Role in network | Risk insight |
|---|---|---|
| National distributor hub | Connects many pharmacies across states through high-volume shipments. | Single point of failure; anomalies here can propagate widely. |
| Regional distributor | Bridges local retail networks with national manufacturers. | Sensitive to regulatory oversight; key for monitoring regional flows. |
| Dense clinical cluster | Small community mixing hospitals, clinics, and pharmacies. | High internal connectivity may hide localized over-prescription patterns. |
8. Interpretation & Strategic Insights
Discussion & Implications
Distribution hubs as bottlenecks
- High-betweenness distributors act as structural bottlenecks for opioid flows.
- Monitoring these hubs can provide early-warning signals for abnormal shipment volumes.
- Targeted interventions at hub level can have disproportionate impact on the whole network.
- From a resilience perspective, hub failures or misuse are the main systemic risk.
Dense clusters as vulnerability zones
- Small, dense communities often correspond to specialized collaborations.
- Their strong internal connectivity may hide localized over-prescription patterns.
- They are ideal candidates for in-depth audits or targeted public health interventions.
- Ignoring these clusters risks missing subtle but high-impact anomalies.
Regulatory & logistic implications
- Graph-based monitoring can complement volume-based thresholds in regulation.
- Community-level metrics help prioritize inspections and audit resources.
- Understanding network structure supports designing more resilient supply chains.
- The methodology generalizes to other controlled substances and regions.
9. Tech Stack & Skills
Tech
- Python (pandas, NetworkX, Matplotlib)
- Neo4j (Cypher, APOC procedures)
- Data formats: CSV, JSONL
- Graph theory & community detection
Skills
- Data pipeline design and batching strategies
- Graph data modeling and query design
- Community detection & modularity analysis
- Scientific-style reporting & visualization
10. Running the Project
Guide d’Exécution
This section summarizes how to reproduce the analysis. In the GitHub repository, it would appear under a README.md with the same structure.
Requirements
- Python 3.10+ (with
pip) - Neo4j 5.x with APOC procedures enabled
- Access to the ARCOS dataset (CSV format)
Example commands
# 1. Install dependencies
pip install -r requirements.txt

# 2. Configure Neo4j connection
export NEO4J_URI=bolt://localhost:7687
export NEO4J_USER=neo4j
export NEO4J_PASSWORD=your_password

# 3. Run preprocessing and CSV generation
python scripts/preprocess_arcos.py

# 4. Import into Neo4j
python scripts/import_to_neo4j.py

# 5. Run analysis (community detection + plots)
python scripts/run_community_detection.py
11. Limitations & Future Work
Perspectives
- Scalability of Girvan–Newman: the algorithm is computationally expensive and was applied on a sampled graph; for the full dataset, methods like Louvain or Label Propagation would be more appropriate.
- Temporal dynamics: this analysis is static; a future extension could track how communities evolve over time (dynamic communities).
- Feature enrichment: integrating external socio-economic or public health data could improve the interpretation of risky communities.
- Graph ML: extending the pipeline towards anomaly detection or risk prediction using graph neural networks or link prediction techniques.
12. What I Learned
This project pushed me to think in graphs, not tables. Handling the data volume, designing a clean graph model, and keeping performance under control while running community detection were all challenging aspects.
I improved my ability to design modular data pipelines, to reason about network structure, and to write research-style documentation that connects technical results to real-world implications.
More broadly, this project fits how I see myself: a data- and math-driven problem solver who cares about systems, clarity, and impact — not complexity for its own sake.